English
  Русский
 Bahasa Indonesia
 Bahasa Malay
 ไทย
ไทย Español
 Deutsch
 Български
 Français
 Tiếng Việt
 中文
中文 বাংলা
বাংলা हिन्दी
 Čeština
 Українська
 Română

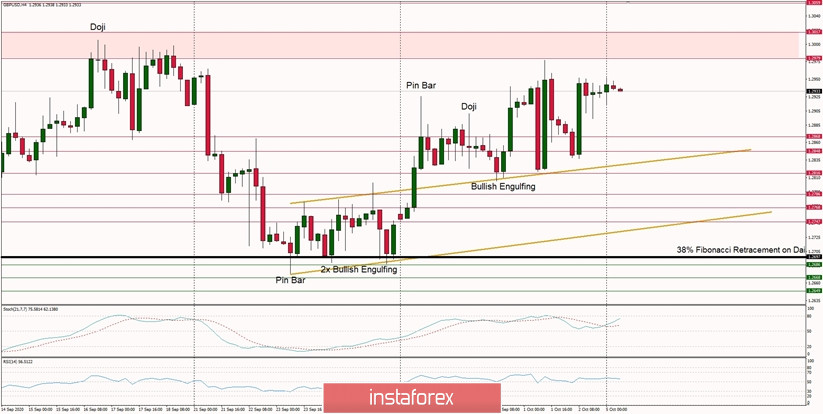
Technical Market Outlook:
The GBP/USD pair has been trading in a narrow range located between the levels of 1.2868 - 2979 where the Bearish Sandwich candlestick pattern had been made at the H4 time frame chart. The price pulled-back towards the level of 1.2848, which is just in the middle of the wide demand zone. Nevertheless, the target for bulls is still seen at the level of 1.2979 and 1.3017 and strong and positive momentum support this short-term outlook despite the overbought market conditions. The technical support for bears is seen at the levels of 1.2848, 1.2816 and 1.2786.
Weekly Pivot Points:
WR3 - 1.3265
WR2 - 1.3116
WR1 - 1.3034
Weekly Pivot - 1.2892
WS1 - 1.2811
WS2 - 1.2658
WS3 - 1.2571
Trading Recommendations:
On the GBP/USD pair the main, multi-year trend is down, which can be confirmed by the down candles on the monthly time frame chart. The key long-term technical resistance is still seen at the level of 1.3518. Only if one of these levels is clearly violated, the main trend might reverse (1.3518 is the reversal level) or accelerate towards the key long-term technical support is seen at the level of 1.1903 (1.2589 is the key technical support for this scenario).