Technical outlook:
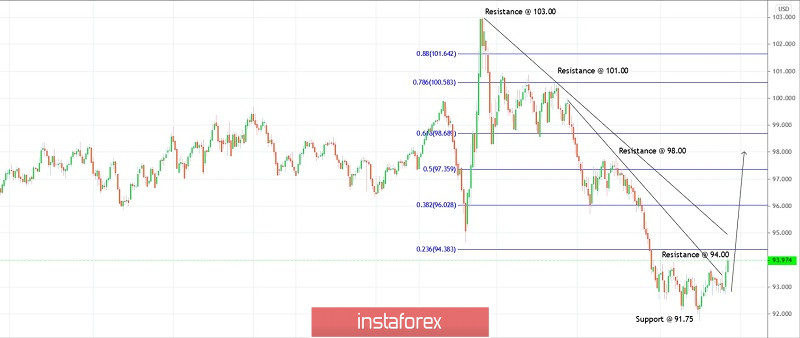
US Dollar Index end of the day chart has been presented here which closed around 93.97 mark yesterday. The index is seen to be trading close to 94.00 levels at this point in writing after having print 94.24 highs during the day. Please note that previous resistance around 94.00 has been taken out today indicating a potential pullback towards 92.70 levels again. Immediate resistance is seen around 94.25, while support is around 92.70 levels respectively. The recent boundary being worked upon could be between 91.75 and 94.24 respectively. The fibonacci 0.618 retracement of the above boundary is seen around 92.70 levels. If prices drop towards 92.70 mark, it should be taken as opportunities to initiate fresh long positions.
Trading plan:
Remain long, stop below 91.75, target is open.
Good luck!
 English
 Русский
 Bahasa Indonesia
 Bahasa Malay
 ไทย
ไทย Español
 Deutsch
 Български
 Français
 Tiếng Việt
 中文
中文 বাংলা
বাংলা हिन्दी
 Čeština
 Українська
 Română

