English
  Русский
 Bahasa Indonesia
 Bahasa Malay
 ไทย
ไทย Español
 Deutsch
 Български
 Français
 Tiếng Việt
 中文
中文 বাংলা
বাংলা हिन्दी
 Čeština
 Українська
 Română

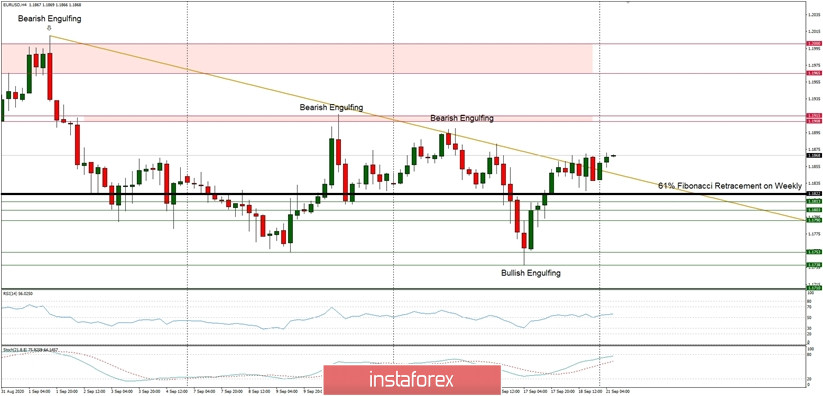
Technical Market Outlook:
The EUR/USD pair had tested the short-term trend line resistance located around the level of 1.1860 and made a new local high at 1.1871. Nevertheless, there is no follow through after the breakout and the bulls do not seem to be entirely in control over the market. The breakout might be a false one, so if the level of 1.1826 is violated, the bears will intensify the pressure.
The levels of 1.1790, 1.1803 and 1.1813 will now act as an intraday technical support for the price, together with the level of 1.1822. The momentum remains weak and negative, so another wave down towards the next target seen at the level of 1.1710 is anticipated. The weekly time frame trend remains up.
Weekly Pivot Points:
WR3 - 1.2077
WR2 - 1.1988
WR1 - 1.1919
Weekly Pivot - 1.1829
WS1 - 1.1748
WS2 -1.1662
WS3 - 1.1583
Trading Recommendations:
On the EUR/USD pair the main trend is up, which can be confirmed by almost 10 weekly up candles on the weekly time frame chart and 4 monthly up candles on the monthly time frame chart. Nevertheless, weekly chart is recently showing some weakness in form of a several Pin Bar candlestick patterns at the recent top. This means any corrections should be used to buy the dips until the key technical support is broken. The key long-term technical support is seen at the level of 1.1445. The key long-term technical resistance is seen at the level of 1.2555.