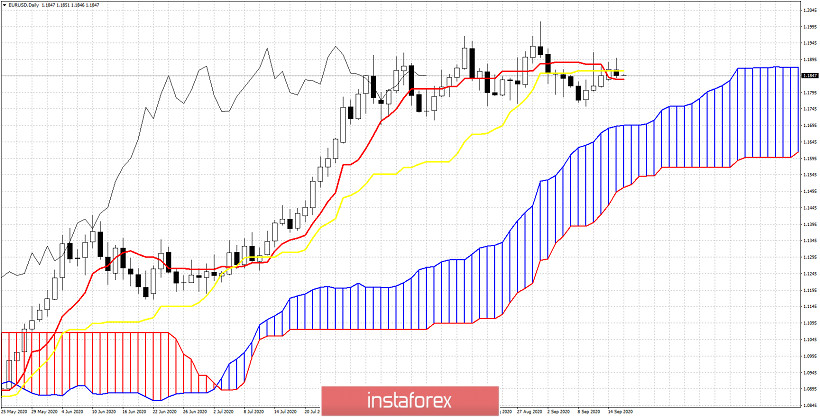
EURUSD remains near its 2020 highs. Price remains in a bullish trend as it stays above the Daily Kumo (cloud). However price is now stuck between the two key short-term indicators (tenkan-sen and kijun-sen).

The tenkan-sen (red line indicator) provides support at 1.1835 while the kijun-sen (yellow line indicator) provides resistance at 1.1860. Breaking either level will provide momentum towards the same direction. Key Daily support by the cloud is found at 1.17. This is the target if price breaks below the tenkan-sen on a daily basis. The Chikou span (black line indicator) is testing support at the candlestick pattern. This means that breaking below 1.1830 will be a bearish sign. Another worrying sign for bulls is the fact that the tenkan-sen (Red line indicator) is below the kijun-sen (yellow line indicator). Bulls want to see the tenkan-sen cross above the kijun-sen. This would be a bullish signal.
Conclusion: Although trend remains bullish, traders should keep a close eye on the key short-term support at 1.1830-1.18 as a break below this support area will open the way for a move towards 1.17. On the other hand if bulls recapture 1.1860-1.19 area then the chances for a move towards new 2020 highs will be higher.
 English
 Русский
 Bahasa Indonesia
 Bahasa Malay
 ไทย
ไทย Español
 Deutsch
 Български
 Français
 Tiếng Việt
 中文
中文 বাংলা
বাংলা हिन्दी
 Čeština
 Українська
 Română

