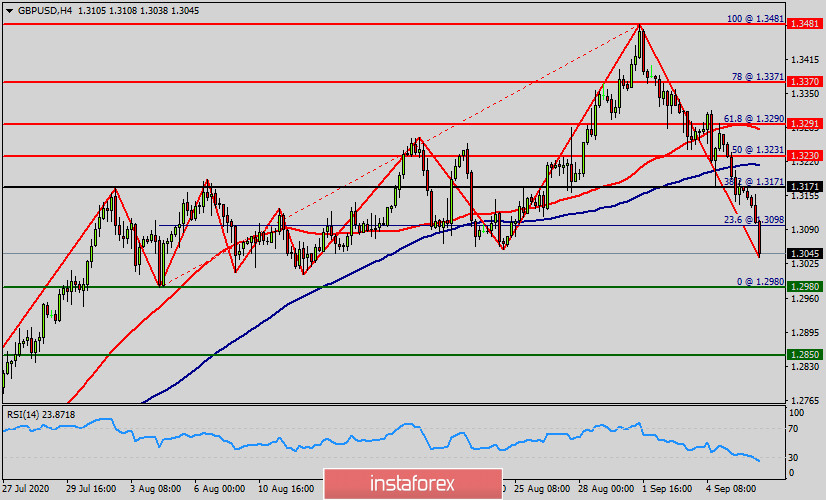
The chart of GBP/USD pair illustrates the amount of trading spent on last week in the one-hour time frame.
Overall, the expenditure of the US Dollar was higher than that of UK. While the Pounds sterling gives around 1.3040 USD right now, on this as opposed to exactly the Pounds sterling gave around 1.3481 USD last week. Consequently, the GBP currency lost more than 440 pips.
This morning, The GBP/USD pair has been breaking support at the level of 1.3171 which acts as a resistance now. The price of 1.3171 is coincided with the daily pivot point at the same time frame.
According to the previous events, the GBP/USD pair is still moving between the levels of 1.3171 and 1.2850. Therefore, we expect a range of 321 pips in coming two days.
The trend has still been setting below the 100 EMA for that the bearish outlook remains the same as long as the 100 EMA is headed to the downside. Hence, the price spot of 1.3171 remains a significant resistance zone.
So, the current price (1.3040) is lower than the moving average 100 and 50. As it is known that the more exactly you find entry points, the higher potential of profitable close of a deal is.
For that reason, there is a possibility that the GBP/USD pair will move downside. The structure of a fall does not look corrective.
As so to indicate a bearish opportunity below 1.3040, sell below 1.3040 with the first target at 1.2980 in order to test the double bottom.
Besides, the weekly support 1 is seen at the level of 1.2980. If the pair succeeds in passing through the level of 1.2980, the market will indicate the bearish opportunity below the level of 1.2980 with a view to reach the second target at 1.2850 (support 2).
However, traders should watch for any sign of a bullish rejection that occurs around 1.3171. The level of 1.3171 coincides with 38.2% of Fibonacci, which is expected to act as a major resistance today. Since the trend is below the 38.2% Fibonacci level, the market is still in a downtrend. Comprehensive, we still prefer the bearish scenario.
 English
 Русский
 Bahasa Indonesia
 Bahasa Malay
 ไทย
ไทย Español
 Deutsch
 Български
 Français
 Tiếng Việt
 中文
中文 বাংলা
বাংলা हिन्दी
 Čeština
 Українська
 Română

