Technical Market Outlook:
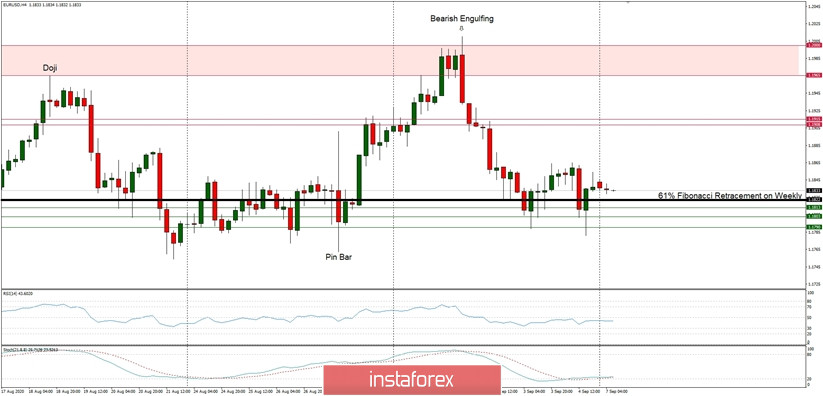
The EUR/USD pair did not move much since the Friday close and keeps hovering around the level of 1.1822, which is a 61% Fibonacci retracement on the weekly time frame chart. This is the key technical level that has been violated before, but the rally did not last for long and the price keeps coming back to it anyway. This kind of a price action might indicate a deeper corrective cycle to come soon as the up trend looks exhausted for now. Any violation of the level of 1.1696 will be the firs indication of a correction. For now however, the key technical support is seen at the level of 1.1790 and the nearest technical resistance is located at 1.1865.
Weekly Pivot Points:
WR3 - 1.2178
WR2 - 1.2088
WR1 - 1.1949
Weekly Pivot - 1.1865
WS1 - 1.1723
WS2 - 1.1635
WS3 - 1.1494
Trading Recommendations:
On the EUR/USD pair the main trend is up, which can be confirmed by almost 10 weekly up candles on the weekly time frame chart and 4 monthly up candles on the monthly time frame chart. This means any corrections should be used to buy the dips. The key long-term technical support is seen at the level of 1.1445. The key long-term technical resistance is seen at the level of 1.2555.

 English
 Русский
 Bahasa Indonesia
 Bahasa Malay
 ไทย
ไทย Español
 Deutsch
 Български
 Français
 Tiếng Việt
 中文
中文 বাংলা
বাংলা हिन्दी
 Čeština
 Українська
 Română

