 English
  Русский
 Bahasa Indonesia
 Bahasa Malay
 ไทย
ไทย Español
 Deutsch
 Български
 Français
 Tiếng Việt
 中文
中文 বাংলা
বাংলা हिन्दी
 Čeština
 Українська
 Română

4h
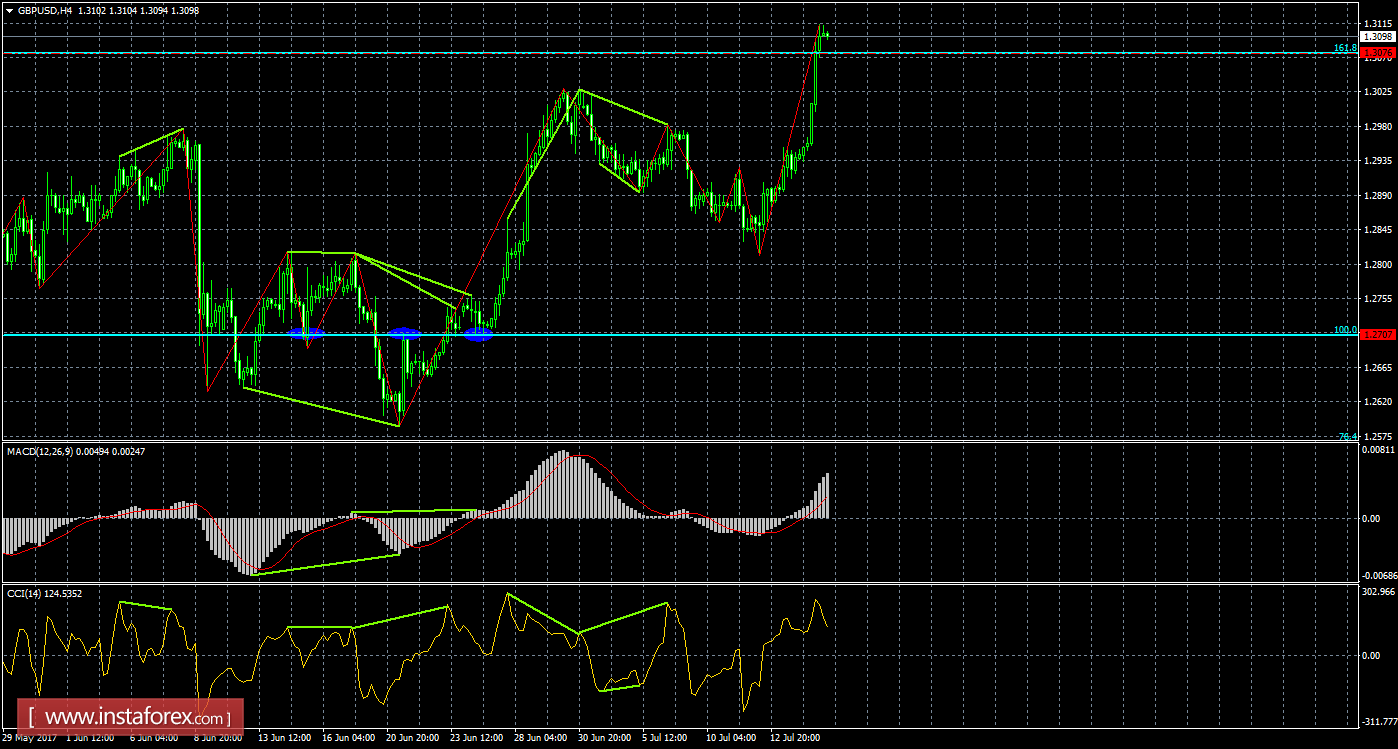
On the 4-hour chart, the GBP/USD pair completed consolidation above the correction level of 161.8% - 1.3076. As a result, on July 17, the process of a growth in prices can be continued in the direction of the next correction level of 200.0% - 1.3305. Emerging divergences are not currently observed in any indicator. The consolidation of the pair's rate below the Fibonacci level of 161.8% will work in favor of the US currency and a fall of the pair in the direction of a correction level of 100.0% - 1.2707.
Daily
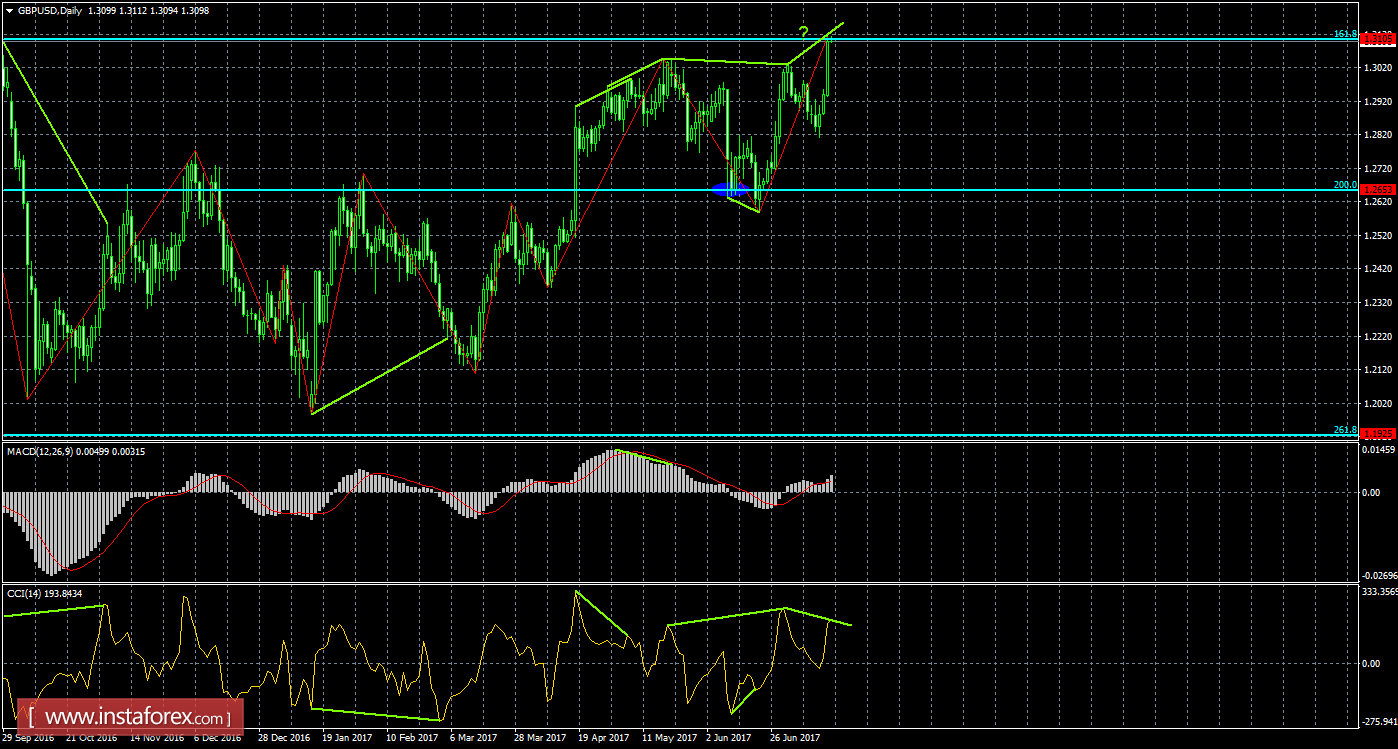
On the 24-hour chart, without the formation of a bullish signal, the pair fulfilled the growth to a correction level of 161.8% - 1.3105. The pair's retracement from the Fibonacci level of 161.8% will allow traders to count on a reversal in favor of the US currency and a slight fall towards the corrective level of 200.0% to 1.2653. The bearish divergence of the CCI indicator is emerging: the last peak of prices is higher than the previous one, and a similar peak of the indicator may turn out to be lower. Fixing the prices above the Fibonacci level of 161.8% will raise the chances of continuing growth towards the next correction level of 100.0% - 1.3835.