Analysis of wave counting:
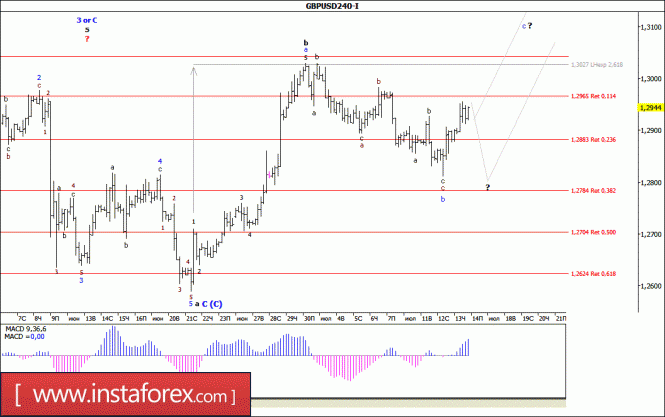
Yesterday, the pair GBP / USD started trading with an upward movement, adding almost 80 percentage points in price and was able to work out the mark of 1,2955 in the middle of the day. The current wave situation allows us to assume that the currency pair significantly complicated the internal wave structure of wave b, b, C, (C), which acquired the signs of an oblique correction triangle. If this is so, and wave b, b, C, (C), will not take an even more complex form, then the currency pair will continue to indicate the growth of quotations, confirming the transition to the stage of formation of the wave c, b, C, (C).
Objectives for a downward wave option:
1,2784 - 38.2% by Fibonacci
1.2704 - 50.0% by Fibonacci
Objectives for an upward wave option:
1.3027 - 261.8% by Fibonacci
1.3100 - 1.3200
General conclusions and trading recommendations:
The British currency may have completed the construction of wave b, b, C, (C). At the moment, the quotations are expected to increase within the wave c, b, C, (C), with targets located near the mark of 1.3027, which corresponds to 261.8% by Fibonacci, and above about 31 and 32 figures.
 English
 Русский
 Bahasa Indonesia
 Bahasa Malay
 ไทย
ไทย Español
 Deutsch
 Български
 Français
 Tiếng Việt
 中文
中文 বাংলা
বাংলা हिन्दी
 Čeština
 Українська
 Română

