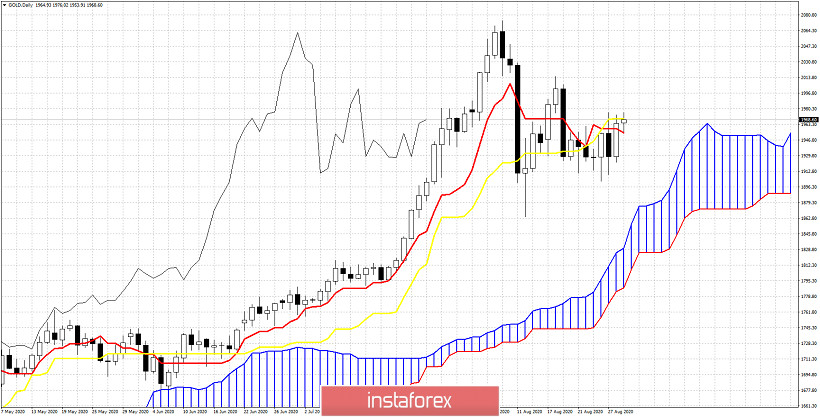
Gold price has bounced strongly off $1,900 support area but the advance has stopped at the major resistance area around $1,950-70 where we find the key indicators tenkan-sen and kijun-sen.

Gold price is above the Daily Kumo. Trend is bullish. Price is above the tenkan-sen (red line indicator) and is challenging the kijun-sen (yellow line indicator). The tenkan-sen is below the kijun-sen and we need to see the tenkan-sen cross above the kijun-sen to get another bullish signal. Price also needs to push above the kijun-sen (yellow line indicator) to have a bullish signal. The Chikou span (black line indicator) is above the candlestick pattern and this confirms bullish trend. A rejection at current levels will be a very bearish sign and could push price back to $1,900 or even lower. Bulls need to break resistance at $1,970 and stay above $1,950.
 English
 Русский
 Bahasa Indonesia
 Bahasa Malay
 ไทย
ไทย Español
 Deutsch
 Български
 Français
 Tiếng Việt
 中文
中文 বাংলা
বাংলা हिन्दी
 Čeština
 Українська
 Română

