Analysis of wave counting:
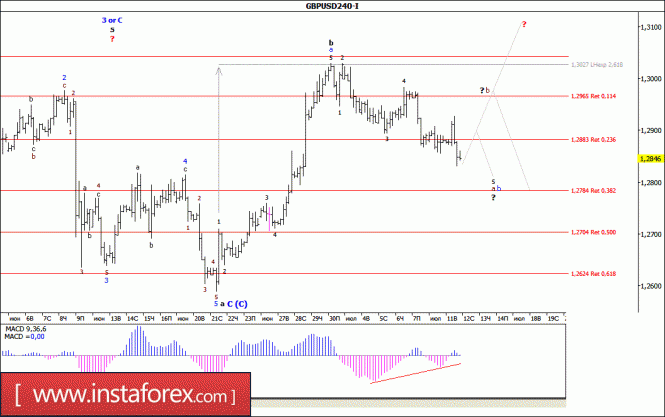
Unable to gain a foothold above the level of the 29th figure, in the second half of yesterday's trading, the pair GBP / USD resumed a downward movement, reaching the level of 1.2830 at the end of the day. At the same time, it seems that the currency pair is still in the formation stage of the wave a, b, b, C, (C); taking a rather complex waveform. If this is the case, then from the minimum of the past day, or after a decline to the level of 1.2800, the currency pair can perform a turn and designate the beginning of the wave b, b, b, C, (C); which is also indicated by the surviving divergence of MACD.
Objectives for a downward wave option:
1,2784 - 38.2% by Fibonacci
1.2704 - 50.0% by Fibonacci
Objectives for an upward wave option:
1.3027 - 261.8% by Fibonacci
1.3100 - 1.3200
General conclusions and trading recommendations:
The British currency has completed the construction of the wave a, C, (C). At the moment, the quotations are expected to decline within the wave b, b, C, (C); with targets located near the mark of 1,2784 and 1,2704, which corresponds to 38.2% and 50.0% of Fibonacci. After the completion of this wave, it is possible to resume the increase in quotations within the wave c, b, C, (C); with targets above 31 figures.
 English
 Русский
 Bahasa Indonesia
 Bahasa Malay
 ไทย
ไทย Español
 Deutsch
 Български
 Français
 Tiếng Việt
 中文
中文 বাংলা
বাংলা हिन्दी
 Čeština
 Українська
 Română

