 English
  Русский
 Bahasa Indonesia
 Bahasa Malay
 ไทย
ไทย Español
 Deutsch
 Български
 Français
 Tiếng Việt
 中文
中文 বাংলা
বাংলা हिन्दी
 Čeština
 Українська
 Română

4-hour timeframe
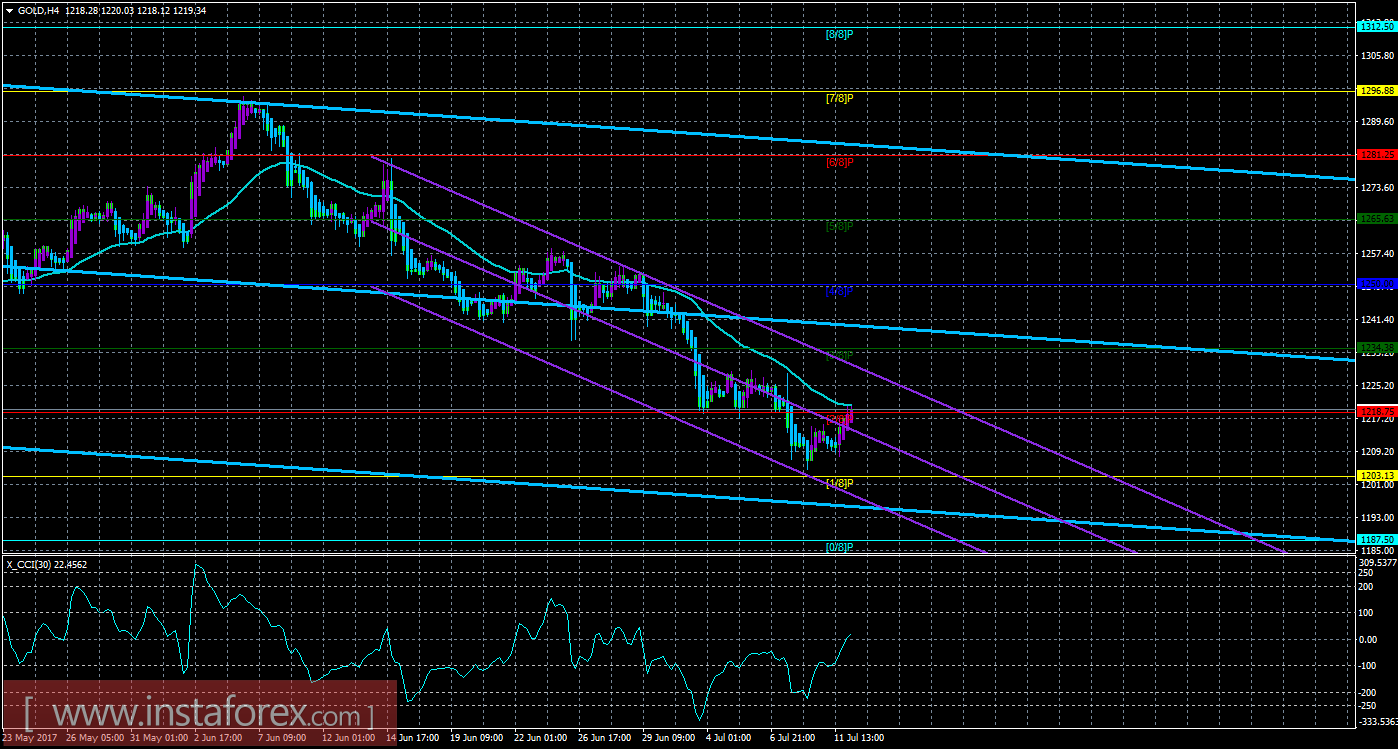
Technical data:
Senior channel linear regression: downward direction.
Junior channel linear regression: downward direction.
Moving average (20; smoothed) - sideways.
CCI: 22.4562
Explanation:
The technical picture for gold on July 12 shows the continuous price correction and the moving average line worked.
The nearest support levels:
S1 - 1203,13
S2 - 1187,50
S3 - 1171,88
The nearest resistance levels:
R1 - 1218,75
R2 - 1234,38
R3 - 1250,00
Trading recommendations:
Based on the analysis of gold exchange rate movement, it can now be concluded that short positions are recommended with the target of 1203.13.
Aside from the technical aspect, traders should also consider the fundamental data and their scheduled releases.
Explanation of illustration:
Senior channel linear regression - blue lines in unidirectional movement.
Junior channel linear regression - purple line in unidirectional movement.
CCI - blue line in the indicator window.
Moving average (20; smoothed) - blue line on the chart.
Murray levels - multicolored horizontal stripes.
Heiken Ashi - the indicator bars colored in blue or purple.