 English
  Русский
 Bahasa Indonesia
 Bahasa Malay
 ไทย
ไทย Español
 Deutsch
 Български
 Français
 Tiếng Việt
 中文
中文 বাংলা
বাংলা हिन्दी
 Čeština
 Українська
 Română

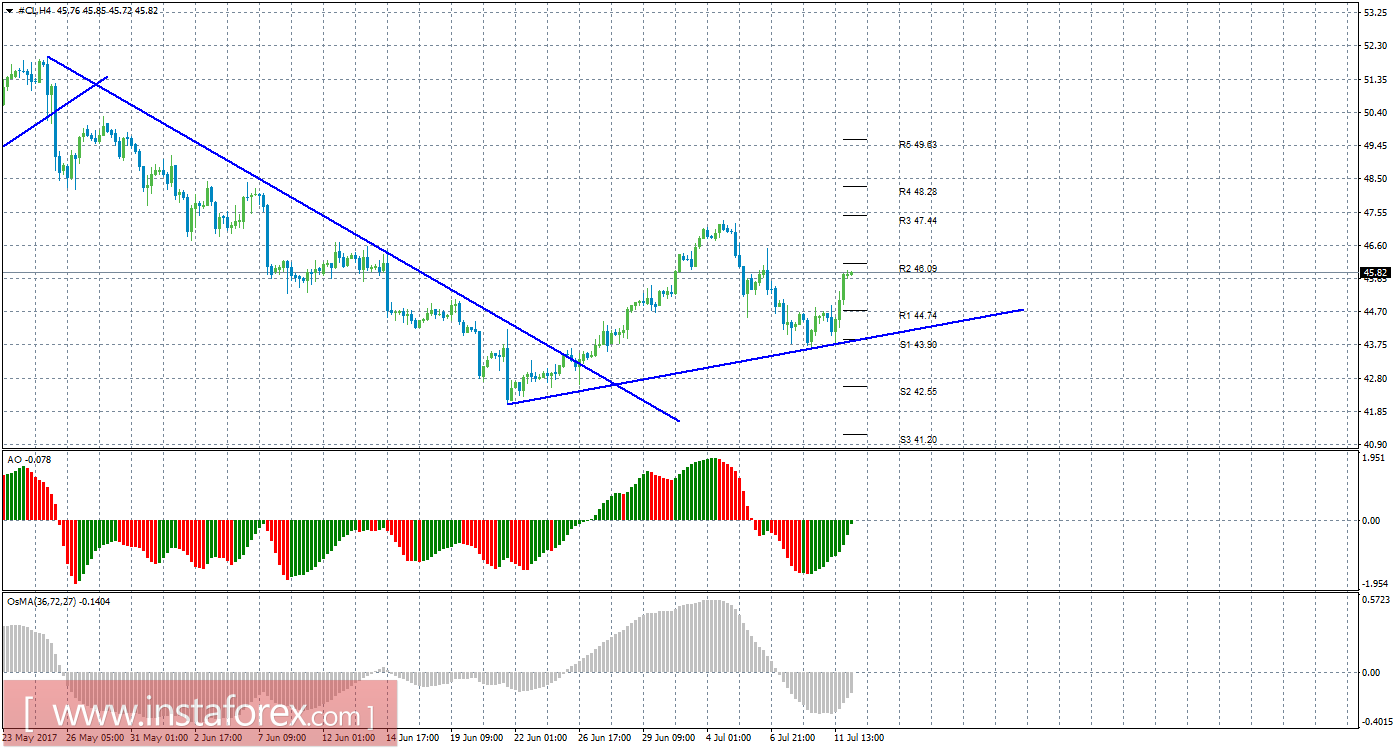
4-hour timeframe
Analysis:
Analysis of crude oil for July 12 shows that the price resumed its upward movement, after failing to break the first support level (S1).
Trading recommendations:
In the course of the oil price movement analysis, it can be concluded that purchasing of orders with targets of 46.09 and 47.44 are now possible. When entering a transaction between 80 to 130 profitability points, it is recommended to transfer the open transaction to break even.
Aside from the technical aspect, traders should also consider the fundamental data and their scheduled releases.
Explanation of illustration:
Awesome Oscillator - red and green bars in the indicators window.
OsMA - gray bars in the indicators window.
Trend lines - blue lines.
Support and Resistance - the red horizontal line.