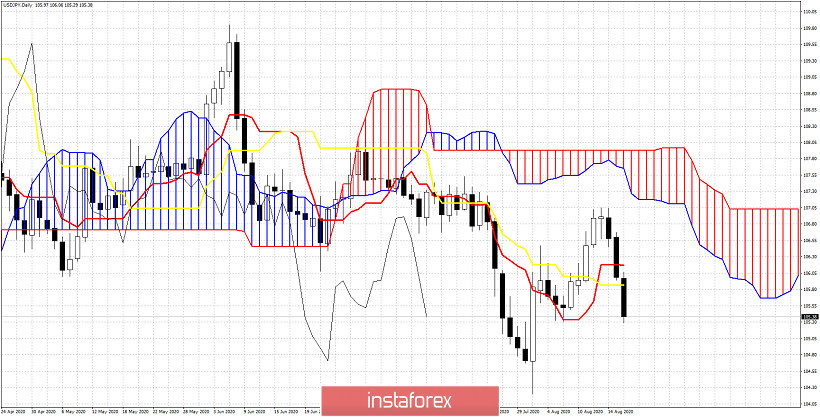
Using the Ichimoku cloud indicator we have a new bearish signal for USDJPY in the Daily chart. Trend remains bearish as price is still below the Daily Kumo (cloud) but today's break below the tenkan-sen and kijun-sen provides even more confirmation of the bearish scenario.

Price is below the Kumo (cloud). This is bearish. Price got rejected near cloud resistance, confirming key resistance is at 107-107.50 area. The Chikou span (black line) indicator is below the candlestick formation and got rejected at 107. This is bearish. As long as the Chikou span is below the candlestick formation the bearish trend remains strong. Price is breaking today below the kijun-sen (yellow line indicator). This is the latest bearish signal and a strong one combined with all the above conditions. Where can we expect price to go next? The recent low just above 104 will be surely be tested and most probably we will see lower levels.
*The market analysis posted here is meant to increase your awareness, but not to give instructions to make a trade

 English
 Русский
 Bahasa Indonesia
 Bahasa Malay
 ไทย
ไทย Español
 Deutsch
 Български
 Français
 Tiếng Việt
 中文
中文 বাংলা
বাংলা हिन्दी
 Čeština
 Українська
 Română

