Technical Market Outlook:
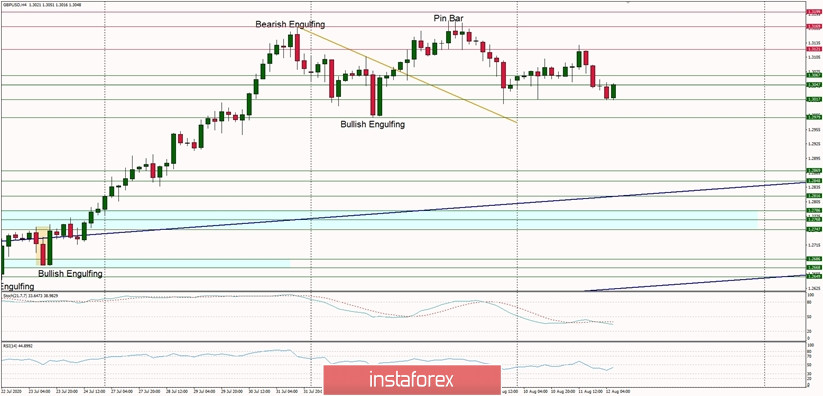
The GBP/USD pair keeps trading in a narrow horizontal range located between the levels of 1.3047 - 1.3100 as the volatility dries up. There is so far no indication of any bearish pressure and all the sideway price action looks like a typical correction in an up trend. The key technical support is seen at the level of 1.2979, so as long as the market trades above it, the odds for another wave up are high. Any breakout above the local high at 1.3121 might accelerate the rally towards the level of 1.3169.
Weekly Pivot Points:
WR3 - 1.3353
WR2 - 1.3261
WR1 - 1.3146
Weekly Pivot - 1.3060
WS1 - 1.2937
WS2 - 1.2860
WS3 - 1.2735
Trading Recommendations:
On the GBP/USD pair the main trend is down, which can be confirmed by the down candles on the weekly time frame chart. The key long-term technical support is seen at the level of 1.1404. The key long-term technical resistance is seen at the level of 1.3518. Only if one of these levels is clearly violated, the main trend might reverse (1.3518) or accelerate (1.1404).

 English
 Русский
 Bahasa Indonesia
 Bahasa Malay
 ไทย
ไทย Español
 Deutsch
 Български
 Français
 Tiếng Việt
 中文
中文 বাংলা
বাংলা हिन्दी
 Čeština
 Українська
 Română

