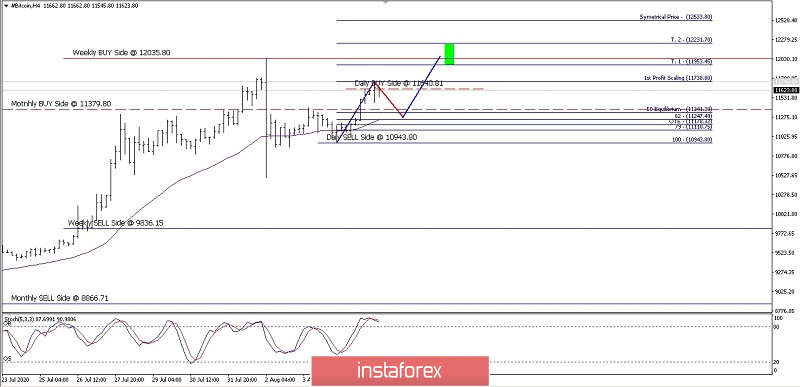
If we look at the 4-hour chart for Bitcoin, we see that the cryptocurrency has been trading sideways in a narrow trading range, although the bullish pressure is still prevailing. This is confirmed by the fact that the price is now moving above the Moving Average. However, there is a potential for BTC to go down as a retracement. This is indicated by the Stochastic Oscillator which has been already at the overbought level. As long as the downward movement does not go lower and the price does not close below the 10,943.80 level, Bitcoin still has prospects to continue its upward movement aiming to test the 12,035.80 level.
(Disclaimer)
 English
 Русский
 Bahasa Indonesia
 Bahasa Malay
 ไทย
ไทย Español
 Deutsch
 Български
 Français
 Tiếng Việt
 中文
中文 বাংলা
বাংলা हिन्दी
 Čeština
 Українська
 Română

