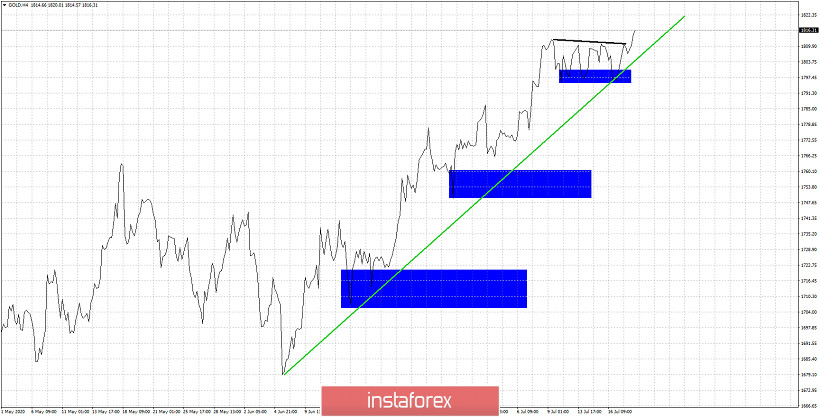
Gold price has broken above the resistance trend line. Support at the blue rectangle area has been respected and price continues to make higher highs and higher lows. It is important for the short-term trend for bulls to hold above $1,800-$1,790.

Green line- support trend line
Black line -resistance trend line
Gold price remains in a bullish trend. Price is breaking above the recent triple top and sideways price action. This is a bullish sign. The latest blue rectangle is now key short-term support and should not be broken to the downside if bulls want to continue to the upside. Breaking below this last blue rectangle and the green trend line support will open the way for a bigger pull back.
 English
 Русский
 Bahasa Indonesia
 Bahasa Malay
 ไทย
ไทย Español
 Deutsch
 Български
 Français
 Tiếng Việt
 中文
中文 বাংলা
বাংলা हिन्दी
 Čeština
 Українська
 Română

