Technical Market Outlook:
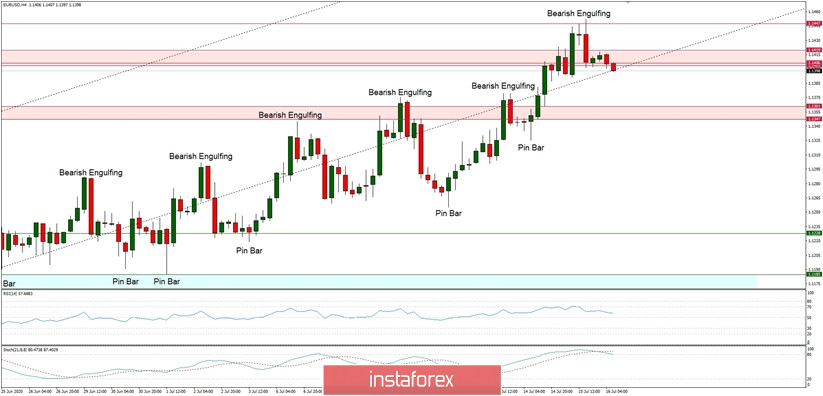
Another Bearish Engulfing candlestick pattern has been made at the top of the last move up at the level of 1.1452, but bulls are not giving up. This is the seventh attempt to rally above the supply zone located between the levels of 1.1406 - 1.1419. The RSI indicator shows the positive and strong momentum, so the market participants should wait for a Pin Bar like candlestick around the level of 1.1400. If there is this kind of a reversal candlestick pattern, then the bulls might continue the local up trend towards the level of 1.1497.
Weekly Pivot Points:
WR3 - 1.1497
WR2 - 1.1428
WR1 - 1.1365
Weekly Pivot - 1.1301
WS1 - 1.1233
WS2 - 1.1170
WS3 - 1.1101
Trading Recommendations:
On the EUR/USD pair, the main long-term trend is down, but the local up trend continues. The key long-term technical support is seen at the level of 1.0336 and the key long-term technical resistance is seen at the level of 1.1540. Only if one of this levels is clearly violated, the main trend might reverse (1.1540) or accelerate (1.0336).

 English
 Русский
 Bahasa Indonesia
 Bahasa Malay
 ไทย
ไทย Español
 Deutsch
 Български
 Français
 Tiếng Việt
 中文
中文 বাংলা
বাংলা हिन्दी
 Čeština
 Українська
 Română

