Technical Market Outlook:
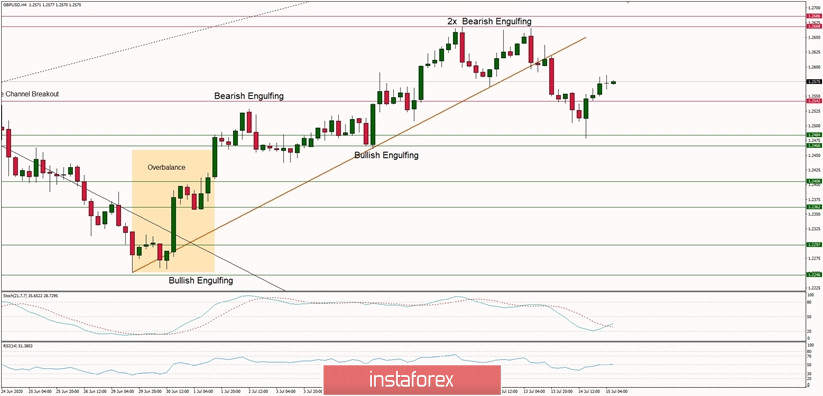
After the GBP/USD pair had made a Double Top price pattern at the level of 1.2668, the bears have managed to push the prices towards the level of 1.2484 which is the key short-term technical support for the market. The price has bounced from support, but no new high was made yet ( the local high was made at the level of 1.2586. The bulls might try to test the trend line from below, but this move would require more momentum in order to get to the level of 1.2640. The RSI indicator shows the momentum is neutral, so neither bulls not bears are in control of the market (on the short-term time frame like H4). Any violation of the level of 1.2466 will accelerate the sell-off towards the next technical support seen at the level of 1.2406.
Weekly Pivot Points:
WR3 - 1.2915
WR2 - 1.2796
WR1 - 1.2712
Weekly Pivot - 1.2585
WS1 - 1.2508
WS2 - 1.2378
WS3 - 1.2304
Trading Recommendations:
On the GBP/USD pair the main trend is down, which can be confirmed by the down candles on the weekly time frame chart. The key long-term technical support has been recently violated (1.1983) and the new one is seen at the level of 1.1404. The key long-term technical resistance is seen at the level of 1.3518. Only if one of these levels is clearly violated, the main trend might reverse (1.3518) or accelerate (1.1404). The market might have done a Double Top pattern at the level of 1.2645, so the price might move even lower in the longer-term.

 English
 Русский
 Bahasa Indonesia
 Bahasa Malay
 ไทย
ไทย Español
 Deutsch
 Български
 Français
 Tiếng Việt
 中文
中文 বাংলা
বাংলা हिन्दी
 Čeština
 Українська
 Română

