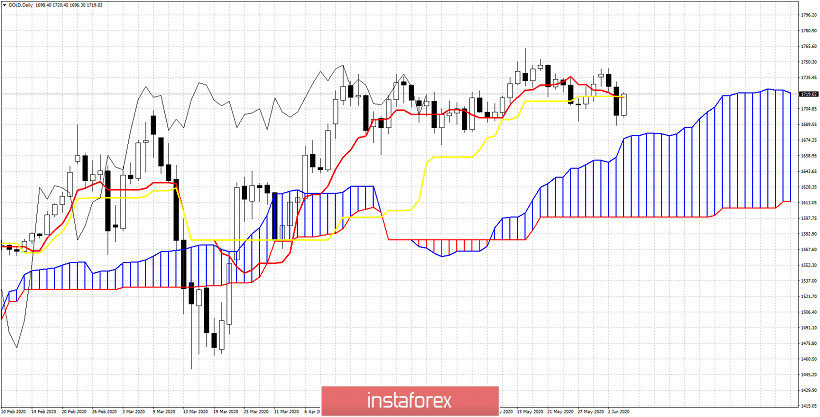
Gold price is bouncing strongly once again towards $1,720. Price has held for another week the $1,700 level unless bears take the upper hand tomorrow. Bulls are trying to recapture the tenkan-sen and kijun-sen pivot point intersection.


Gold price is approaching the 61.8% Fibonacci retracement of the recent decline. The 61.8% Fibonacci level is at $1,722. As one can clearly see the area of $1,700-$1,725 is a very important area for Gold. Price has been mostly moving around it since early April. Focusing on the bigger picture, the levels to watch are 1.785-90 (need to break $1,745 for this target to be achieved) and $1,670-40 (need $1,700 to break on a weekly basis).
 English
 Русский
 Bahasa Indonesia
 Bahasa Malay
 ไทย
ไทย Español
 Deutsch
 Български
 Français
 Tiếng Việt
 中文
中文 বাংলা
বাংলা हिन्दी
 Čeština
 Українська
 Română

