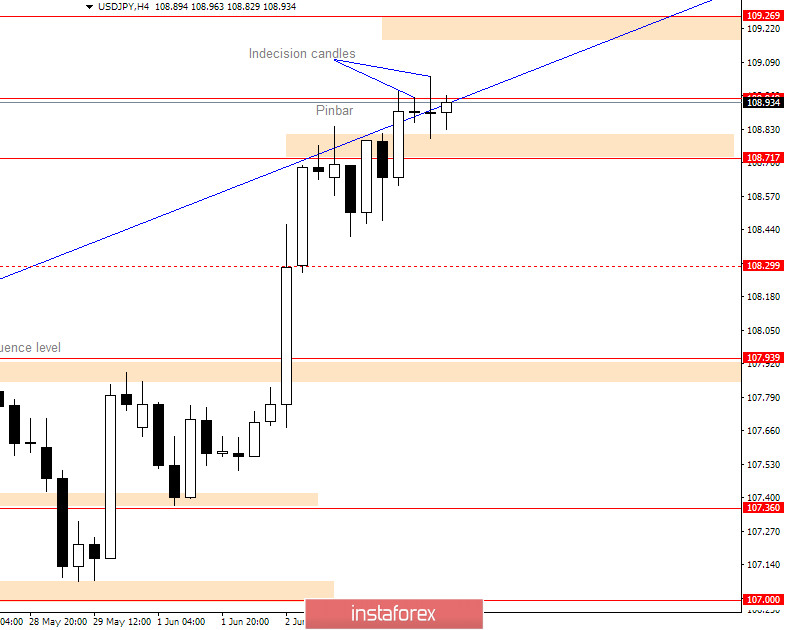
The USD/JPY chart. Yesterday's summary:
After yesterday's analysis, bulls managed to push the price to the level of 109.00 and then stopped.
Before making a move up, the price pulled back from the 108.717 level. After that, bulls continued pushing the price higher to 109.035 and since then, we have indecision.
During the last few trading sessions, two unclear candles were formed. The first one was small and the second one was large.
Both unclear candles suggest that we have a fight between bulls and bears.
Outlook for USD/JPY

Bulls tried to break from the indecision zone, but bears managed to keep the price on the 109.00 level.
We can also see the next resistance line on the H4 chart. Thus, the next move for bulls could be hard.
As there are no strong bearish candles, it seems that bulls could dominate.
The USD/JPY chart. Bullish Scenario:
For bulls next goal is to reach the 109.269 level, which is a strong level that acted as resistance in the past. Last time when this level acted as a resistance was two months ago on 06.04.2020.
From the 107.00 level, the pair may move up to 109.269 and then reverse back to 107.00.
Now, we should look for the price reaching 109.269. If the price manages to close above that level, we could see the next move up to the 111.628 level.
USD/JPY. Bearish Scenario:
Bears may have a chance to make a reversal at the 109.269 level, if they find enough strength. The situation repeats again.
To make that happen, bears need to form a strong bearish price action signal at the 109.269 level and then, close below 108.717 to turn the market back down.
 English
 Русский
 Bahasa Indonesia
 Bahasa Malay
 ไทย
ไทย Español
 Deutsch
 Български
 Français
 Tiếng Việt
 中文
中文 বাংলা
বাংলা हिन्दी
 Čeština
 Українська
 Română

