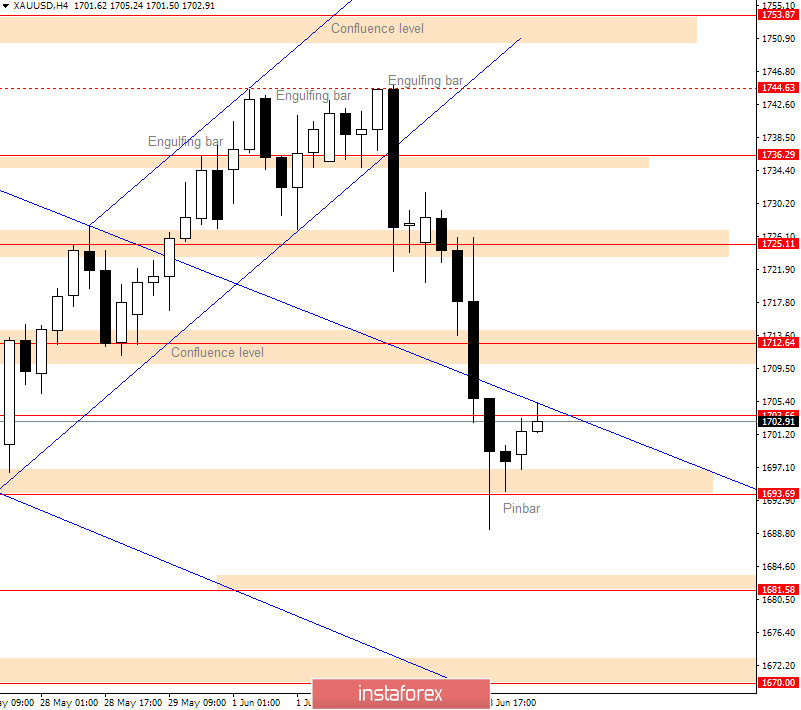
Yesterday's chart on XAU/USD
Gold has changed from the bullish sentiment into the bearish one after a drop from 1,744.63 to 1,693.69.
From eight candles only two were bullish. This is a sign of a strong bearish move. The price was not trading on the support level for a long time. This should have supported bulls.
The current level of 1,693.69 acted as a strong support level on May 27th, 2020. At that moment, bears were moving the price from the 1,753.87 level.
Outlook for XAU/USD:

We can see the bullish Pinbar that does not give too much confidence that there will be a rise. The price is hovering between strong support and resistance levels. This area is between 1,693.69 and 1,725.11.
If the price moves outside the range area, we will know where it may move.
The XAU/USD chart. Bullish Scenario:
The first level that bulls must break is a small resistance around 1,712.64. The bullish Pinbar could push the price to this level, but for a stronger move we need to see higher activity from bulls.
If the price manages to break above the 1,725.11 level, we could see the price moving higher to 1,736.29 and 1,753.87.
The XAU/USD chart. Bearish Scenario:
Bears have shown strength. To push the price lower, they need to have a close below 1,693.69 on the H4 time frame.
The first level that could be considered as a signal is 1,712.64, only if the price pulls back to that level.
When the price breaks below 1,693.69, it could make a move to the 1, 670.00 level that was a strong support in the past.
 English
 Русский
 Bahasa Indonesia
 Bahasa Malay
 ไทย
ไทย Español
 Deutsch
 Български
 Français
 Tiếng Việt
 中文
中文 বাংলা
বাংলা हिन्दी
 Čeština
 Українська
 Română

