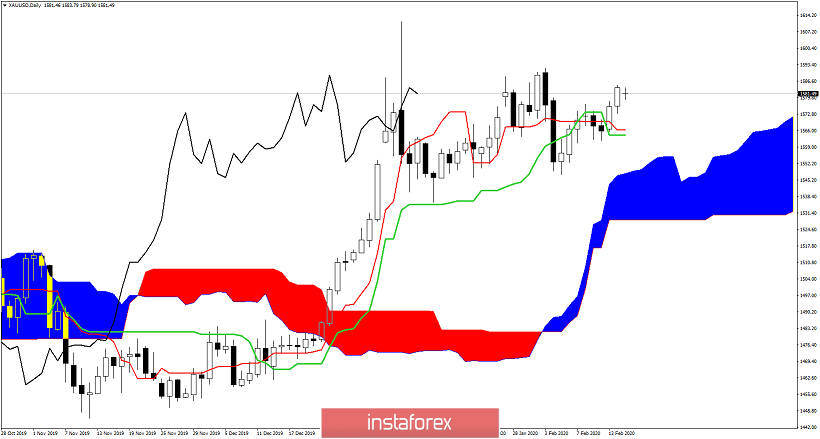
Gold price has recaptured the important resistance level of $1,575 and has so far canceled our view for a pull back towards $1,500. Short-term trend is bullish and the Ichimoku cloud indicator confirms that also.

Green lines - bullish channel
Gold price is forming a short-term bullish channel. Price has broken above the 61.8% Fibonacci retracement level and is now challenging the 78.6% retracement. As long as price is above $1,563 short-term trend will remain bullish.

Price remains above the Kumo (cloud) and is now once again above both the tenkan- and kijun-sen indicators. If the green indicator (tenkan-sen) turns above the red indicator (kijun-sen) then we will have a strong bullish signal. Support by both the tenkan- and kijun-sen is found at $1,563-66. Holding above this level is key for a move towards $1,600 and higher.
*The market analysis posted here is meant to increase your awareness, but not to give instructions to make a trade


 English
 Русский
 Bahasa Indonesia
 Bahasa Malay
 ไทย
ไทย Español
 Deutsch
 Български
 Français
 Tiếng Việt
 中文
中文 বাংলা
বাংলা हिन्दी
 Čeština
 Українська
 Română

