Overview:
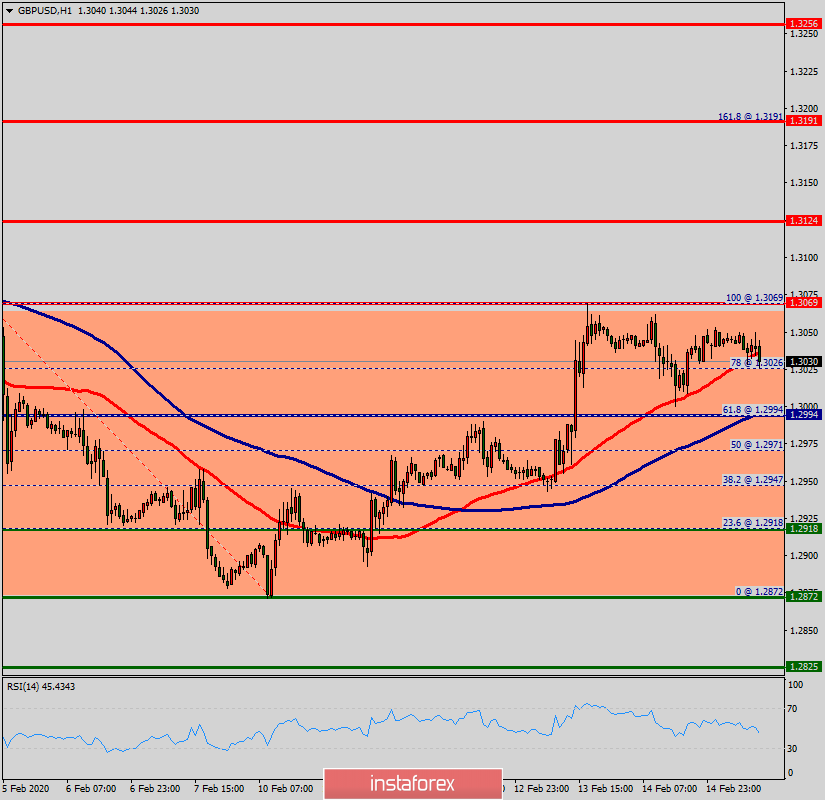
Ranging day between the levels of 1.2872 and 1.3069.
The GBP/USD pair is consolidating the weekly gains above the 1.2918 support as bulls remain in control. A break above 1.2994 can expose the 1.3069 resistance, according to the technical RSI Indicator. Amid the previous events, the price is still moving between the levels of 1.2918 and 1.3069. In overall, we still prefer the bullish scenario as long as the price is above the level of 1.2918. The daily pivot point stands at the point of 1.2994 in the H1 time frame.
The shared currency is trading in a bear trend below the 100 and 50-day exponential moving averages (EMAs). The Cable is breaking above a multi-week trendline and is challenging the 100 EMA. The news limited further gains in the New York session. Suggesting bullish momentum in the medium term. Furthermore, if the NZD/USD pair is able to break out the daily pivot point at 1.2994, the market will decline further to 1.3069 (daily resistance 1). Bearish outlook: On the other hand, if the price closes below the point of 1.2994, the best location for a stop loss order is seen above .3100. The price will fall into a bearish trend in order to go further towards the strong support at 1.2872 to test it again. The level of 1.2872 will form a double botto at the same time frame.
 English
 Русский
 Bahasa Indonesia
 Bahasa Malay
 ไทย
ไทย Español
 Deutsch
 Български
 Français
 Tiếng Việt
 中文
中文 বাংলা
বাংলা हिन्दी
 Čeština
 Українська
 Română

