 English
  Русский
 Bahasa Indonesia
 Bahasa Malay
 ไทย
ไทย Español
 Deutsch
 Български
 Français
 Tiếng Việt
 中文
中文 বাংলা
বাংলা हिन्दी
 Čeština
 Українська
 Română

EURUSD is trading below 1.11 just above major Ichimoku cloud support. Price is also inside an upward sloping channel and now the conditions favor traders to take bullish positions as the risk relative to the potential profit is very low. Support at 1.1065-1.1050 is key and this should be used as a stop from bulls.
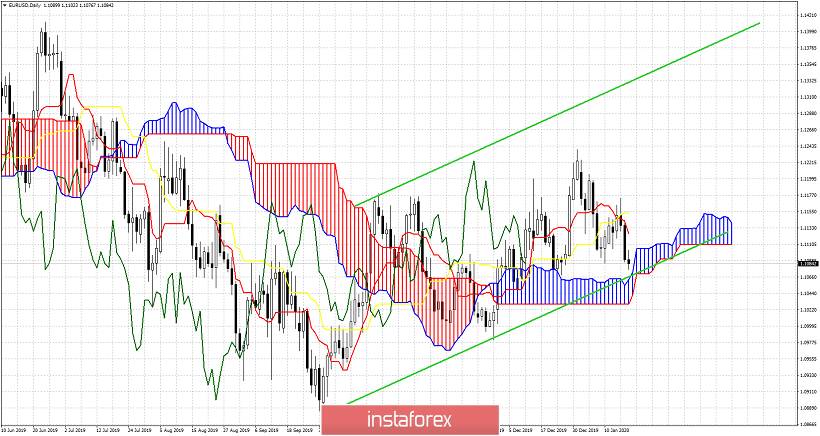
Price is above the Kumo support at 1.1065. The lower channel boundary is at 1.1050-1.1060. As long as price is above this level we are bullish on a daily basis. The Chikou span (green line) is above the candlestick pattern and above cloud support. In fact this line is now challenging the support. If support holds I would expect a bounce and a new upward move maybe towards 1.13 if 1.1155 is recaptured. The risk for being long at current levels is very low and that is why I turn short-term bullish again. Trying to pick a bottom.