 English
  Русский
 Bahasa Indonesia
 Bahasa Malay
 ไทย
ไทย Español
 Deutsch
 Български
 Français
 Tiếng Việt
 中文
中文 বাংলা
বাংলা हिन्दी
 Čeština
 Українська
 Română

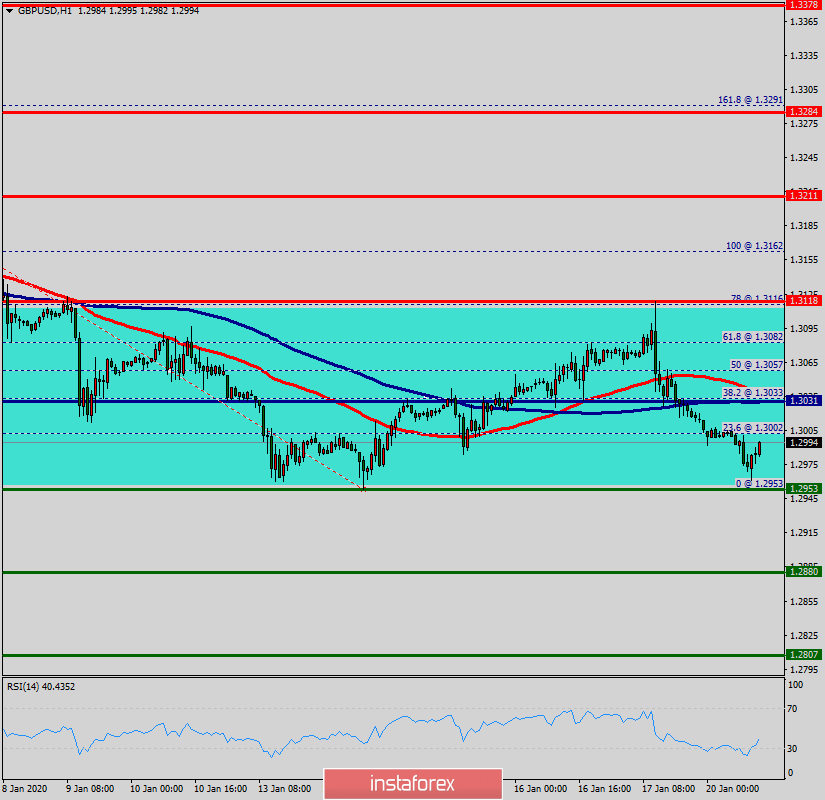
Overview:
Pivot point: 1.3031.
The GBP/USD pair is in a bearish channel now since last week. Amid the previous events, the pair is still in a downtrend. From this point, the GBP/USD pair is continuing in a bearish trend from the new resistance of 1.3031. The price spot of 1.3031 remains a significant resistance zone. Therefore, a possibility that the GBP/USD pair will have downside momentum is rather convincing and the structure of a fall does not look corrective. Last week, the GBP/USD pair fell from the level of 1.3118 to bottom at 1.2953 yesterday. Currently, the price is in a bearish channel. This is confirmed by the RSI indicator signaling that we are still in a bearish trending market. The bias remains bearish in the nearest term testing 1.2953 and 1.2880. Immediate resistance is seen around 1.3031 levels, which coincides with the weekly pivot. Moreover, the moving average (100) starts signaling a downward trend; therefore, the market is indicating a bearish opportunity below 1.3031. So it will be good to sell at 1.3031 with the first target of 1.2953. It will also call for a downtrend in order to continue towards 1.2880. The strong weekly support is seen at 1.2807. However, if a breakout happens at the resistance level of 1.3120, then this scenario may be invalidated.