 English
  Русский
 Bahasa Indonesia
 Bahasa Malay
 ไทย
ไทย Español
 Deutsch
 Български
 Français
 Tiếng Việt
 中文
中文 বাংলা
বাংলা हिन्दी
 Čeština
 Українська
 Română

GBPUSD started the last session of the week on a strong note but the day found the pair near the lowest of the week and with a lower weekly close relative to the previous week. Price reversed at the upper channel boundary as expected and we continue to expect the resumption of the downtrend to give us at least a new lower low below 1.29.
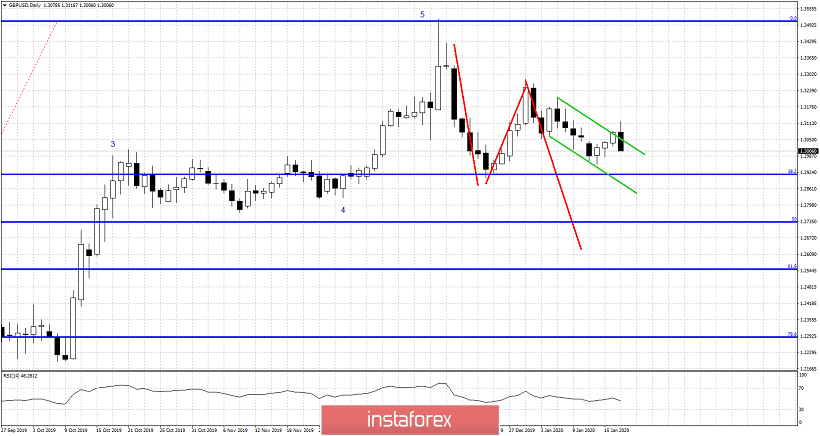
Green lines -short-term bearish channel
GBPUSD remains in a bearish trend. Short-term support is found at 1.2954 and resistance at 1.3080. If support fails to hold I expect a test of 1.29 with high chances of breaking below it. The next important support after 1.29 is at the 61.8% Fibonacci retracement level. If resistance breaks above 1.3080 I believe we will most likely continue moving sideways and form a triangle pattern. In either case I do not see much upside potential for GBPUSD.