 English
  Русский
 Bahasa Indonesia
 Bahasa Malay
 ไทย
ไทย Español
 Deutsch
 Български
 Français
 Tiếng Việt
 中文
中文 বাংলা
বাংলা हिन्दी
 Čeština
 Українська
 Română

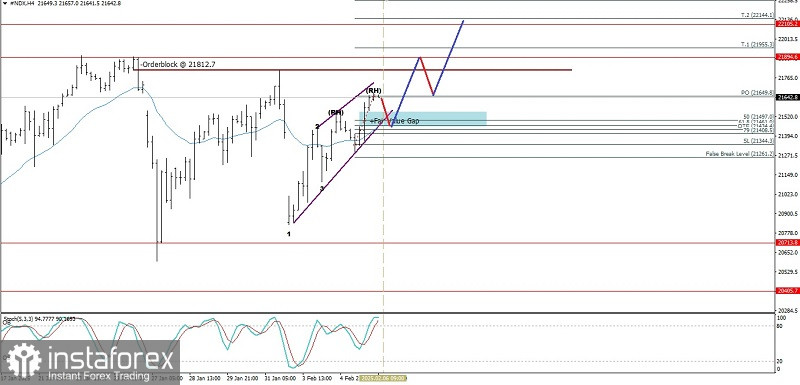
With the appearance of the Bullish 123 pattern followed by 2 Bullish Ross Hook (RH) and confirmed by the price movement of the Nasdaq 100 Index which is moving above the EMA (21) which also has an upward slope, then in the near future GBP/JPY has the potential to appreciate and strengthen upwards to the level of 21812.7 if it is successfully breaks and closes above it, then #NDX has the potential to continue its strengthening to the level of 21955.3 and if the strengthening momentum and volatility support it, then 22105.2 will be the next target to be targeted, but please also note that on this 4 hour chart, a Rising Wedge pattern also appears which indicates a potential for a weakening correction, but as long as the weakening that occurs does not break and close below 21261.2, the strengthening scenario that has been described previously will continue.
(Disclaimer)