 English
  Русский
 Bahasa Indonesia
 Bahasa Malay
 ไทย
ไทย Español
 Deutsch
 Български
 Français
 Tiếng Việt
 中文
中文 বাংলা
বাংলা हिन्दी
 Čeština
 Українська
 Română

USDJPY continues to make higher highs and higher lows respecting so far the latest low. However the price is most probably forming a bearish wedge pattern. Combined with the fact that we are approaching the major downward resistance trend line at 110.30, there are increased chances of a trend reversal between now and 110.30.
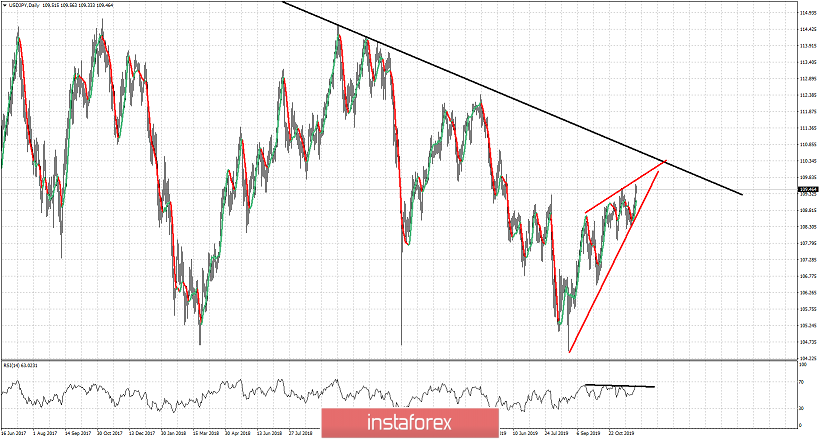
Black line - major resistance trend line
RSI black line - bearish divergence
Red lines - wedge pattern
USDJPY is making new higher highs and higher lows. Trend is bullish.However as can be seen in the Daily chart above, a bearish wedge pattern is being formed. Support is critical at 108.50 and breaking below it will be a bearish signal. Resistance is found now at 109.70-110.30 area. The closest important resistance is at 109.70. There is still room to continue the higher highs and higher lows pattern, but the bearish divergence in the RSI warns us that bulls need to be very cautious.