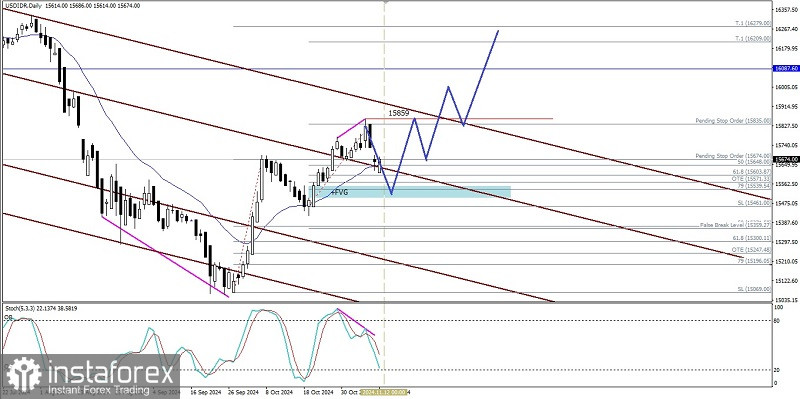
If we look at the daily chart of the exotic currency pair USD/IDR, although it appears to be moving in the Bearish Pitchfork channel harmoniously, there is currently a strengthening correction where the Garuda currency is strengthening against the Greenback, although it is currently weakening again, where this weakening has the potential to bring USD/IDR to the level of 15539.54, but as long as it does not break through and close below the level of 15461 USD/IDR still has the potential to continue strengthening to the level of 15859 and if this level is successfully broken upwards, USD/IDR will continue strengthening to the level of 16087.60 and if the momentum and volatility support it, 16209 will be the next target to be aimed of.
(Disclaimer)
 English
 Русский
 Bahasa Indonesia
 Bahasa Malay
 ไทย
ไทย Español
 Deutsch
 Български
 Français
 Tiếng Việt
 中文
中文 বাংলা
বাংলা हिन्दी
 Čeština
 Українська
 Română

