 English
  Русский
 Bahasa Indonesia
 Bahasa Malay
 ไทย
ไทย Español
 Deutsch
 Български
 Français
 Tiếng Việt
 中文
中文 বাংলা
বাংলা हिन्दी
 Čeština
 Українська
 Română

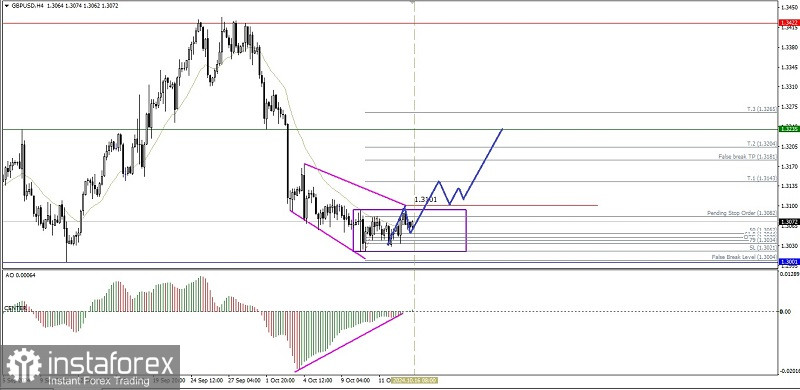
Although currently on the 4-hour chart the main currency pair GBP/USD is moving in a Sideways condition where this is confirmed by the EMA 21 moving between the candlestick bodies, but with the appearance of the Descending Broadening Wedge pattern and the deviation between the Cable price movement which forms a Lower Low while the Awesome Oscillator indicator actually forms a Lower-High, it gives an indication that in the near future Cable has the potential to appreciate and strengthen upwards where the level of 1.3101 will be tested to be penetrated and close above that level if there is no significant weakening correction that breaks and closes below the level of 1.3021, then GBP/USD will continue to strengthen to the level of 1.3143 as its main target and if the momentum and volatility support it, 1.3235 will be the next target to be aimed for.
(Disclaimer)