 English
  Русский
 Bahasa Indonesia
 Bahasa Malay
 ไทย
ไทย Español
 Deutsch
 Български
 Français
 Tiếng Việt
 中文
中文 বাংলা
বাংলা हिन्दी
 Čeština
 Українська
 Română

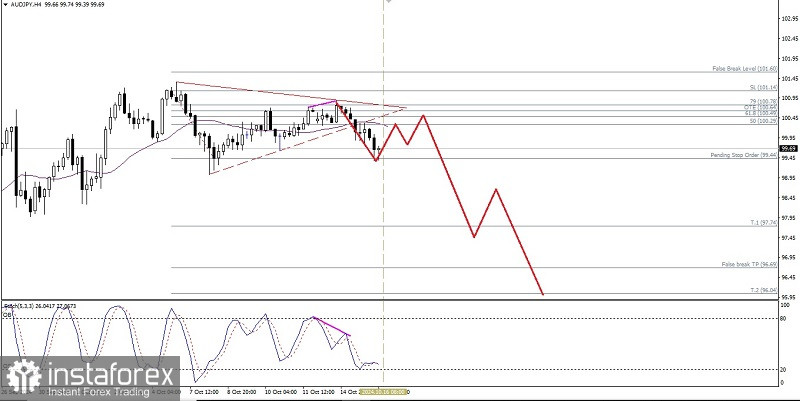
From what we can see on the 4-hour chart of the AUD/JPY cross currency pair, it appears that the AUD/JPY price movement is below the WMA 30 shift 2, which means that currently the pressure from the Sellers is still quite significant. This is also confirmed by the price movement of this currency pair which has successfully broken down below its triangle pattern, especially with the appearance of deviations between the price movement of AUD/JPY which makes a higher-high while the Stochastic Oscillator indicator actually forms a Higher-Low which shows that in the near future AUD/JPY has the potential to weaken, but before that happens, AUD/JPY could experience strengthening in order to gather momentum for the price movement of this currency pair to fall again, but as long as the strengthening does not break and close above the 100.78 level, AUD/JPY will continue to weaken and test the 99.44 level for the umpteenth time. If this level is successfully broken below, AUD/JPY will continue to weaken to 97.74 and 96.04 if the momentum and volatility support it.
(Disclaimer)