 English
  Русский
 Bahasa Indonesia
 Bahasa Malay
 ไทย
ไทย Español
 Deutsch
 Български
 Français
 Tiếng Việt
 中文
中文 বাংলা
বাংলা हिन्दी
 Čeština
 Українська
 Română

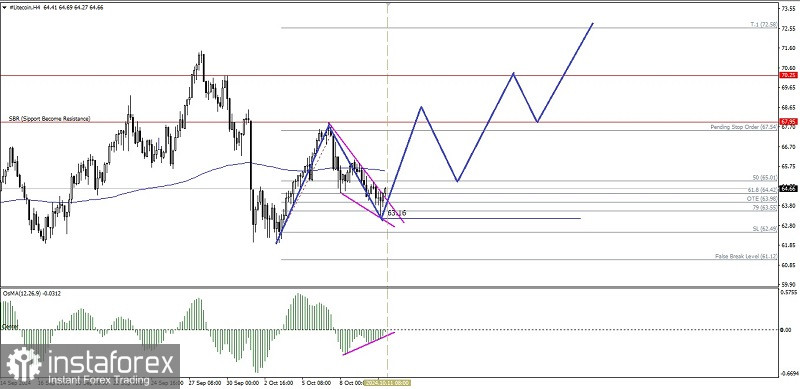
On the 4-hour chart, the Litecoin cryptocurrency appears to be moving in a Sideways condition, confirmed by the EMA 200 which is moving flat and penetrating breaks the candle bodies, even so, with the appearance of deviations between the Litecoin price movement and the MACD Histogram (osMA) indicator and the appearance of the Failing Wedge pattern, it gives an indication that in the near future Litecoin has the potential to strengthen upwards to test the level of 65.01. If this level is successfully broken upwards, Litecoin has the opportunity to continue its strengthening to the level of 67.54 as its main target and 70.25 as the next target if momentum and volatility support it, but all of this will be invalid and canceled by itself if on its way to strengthening upwards suddenly #LTC turns down and weakens until it breaks through and closes below the level of 61.12.
(Disclaimer)