 English
  Русский
 Bahasa Indonesia
 Bahasa Malay
 ไทย
ไทย Español
 Deutsch
 Български
 Français
 Tiếng Việt
 中文
中文 বাংলা
বাংলা हिन्दी
 Čeština
 Українська
 Română

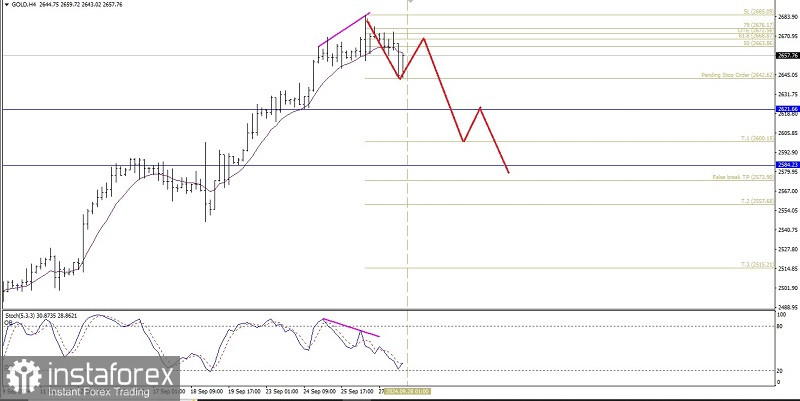
If we look at the 4-hour chart of the Gold commodity asset, it appears that there is a deviation between the price movement of the Gold commodity asset and the Stochastic Oscillator indicator. This indicates that in the near future, as long as there is no strengthening that breaks above the level of 2685.09, Gold has the potential to weaken to the level of 2642.62 and if this level is successfully penetrated below, Gold has the potential to continue its weakening to the level of 2621.66 as its main target and if the momentum and volatility support it, Gold will continue its weakening to the level of 2584.33.
(Disclaimer)