 English
  Русский
 Bahasa Indonesia
 Bahasa Malay
 ไทย
ไทย Español
 Deutsch
 Български
 Français
 Tiếng Việt
 中文
中文 বাংলা
বাংলা हिन्दी
 Čeština
 Українська
 Română

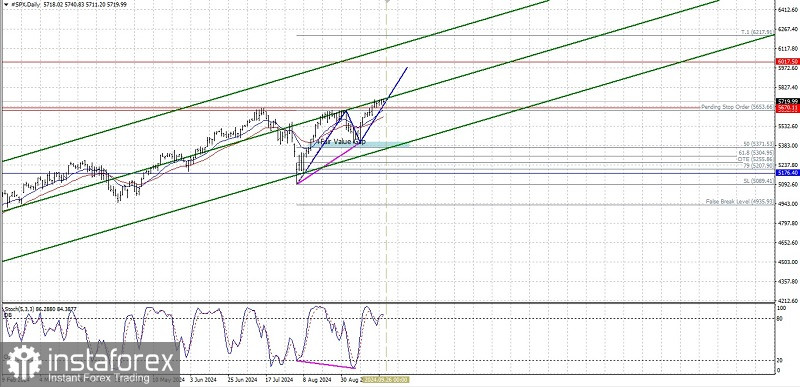
On the daily chart, the S&P 500 index appears to be moving harmoniously within a channel that is diving upwards and is supported by the appearance of hidden deviations between the #SPX price movement and the Stochastic Oscillator indicator and its price movement which is above the EMA 21 & EMA 34 where these three things indicate that #SPX is under the control of Buyers so that in the next few days SPX has the potential to continue its strengthening to the level of 6017.50 as its main goal and if the momentum and volatility support it, the level of 6217.91 will be the next target to be aimed for with the note that during its journey to the target levels mentioned earlier there is no significant weakening correction, especially the level of 5346.11 because if this level is successfully broken downwards, all strengthening scenarios that have been described previously will become invalid and automatically cancel all strengthening scenarios.
(Disclaimer)