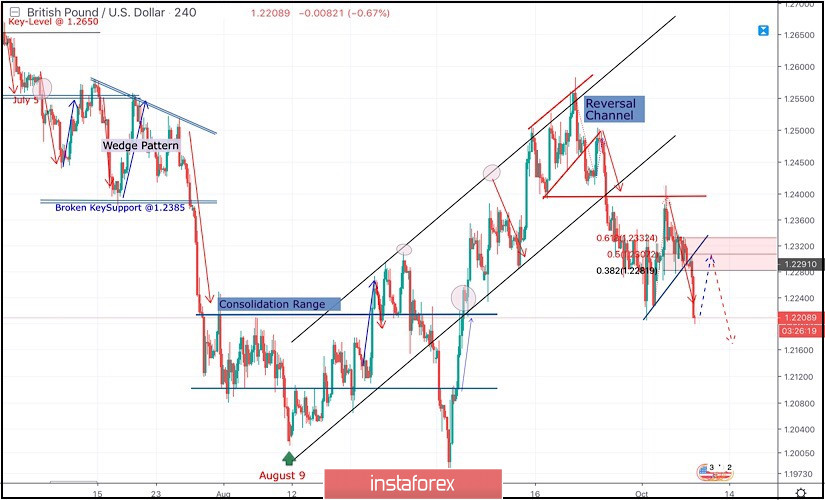
On August 9, the depicted bullish channel has been established.
Since then, the GBP/USD pair has been trending-up except on September 3 when a temporary bearish breakout was demonstrated towards 1.1960.
Around the price level of 1.1960, aggressive signs of bullish recovery (Bullish Engulfing candlesticks) brought the GBPUSD back inside the depicted movement channel.
Moreover, Temporary bullish advancement was demonstrated towards 1.2550 where a short-term reversal channel was demonstrated.
As anticipated, the reversal channel was broken-down on September 23 supported by obvious bearish price action demonstrating a successful bearish closure below 1.2450.
On September 25, the depicted bullish channel was finally terminated with significant full-body bearish candlesticks which managed to achieve bearish closure below 1.2395.
The Short-term outlook remains bearish as long as the most recent top established around 1.2400 remains defended by the GBP/USD bears.
Bearish persistence below 1.2400-1.2440 (Reversal-Pattern Neckline) allowed more bearish decline to occur towards the price levels of 1.2210 where a recent bullish pullback towards 1.2400 was previously originated on October 2.
This week, the price zone of 1.2300-1.2330 (Fibonacci Cluster Zone) remains a significant SUPPLY zone to be watched for SELL entries if any bullish pullback occurs.
On the other hand, bearish persistence below 1.2220 is mandatory to allow further bearish decline towards 1.2160 and 1.2120.
Trade Recommendations:
Conservative traders are advised to consider any bullish pullback towards the Fibonacci Cluster Zone (Anywhere around 1.2300-1.2330) as a valid SELL entry.
T/P levels to be placed around 1.2330, 1.2280, 1.2240 and 1.2160 while S/L should be placed above 1.2450.
 English
 Русский
 Bahasa Indonesia
 Bahasa Malay
 ไทย
ไทย Español
 Deutsch
 Български
 Français
 Tiếng Việt
 中文
中文 বাংলা
বাংলা हिन्दी
 Čeština
 Українська
 Română

