 English
  Русский
 Bahasa Indonesia
 Bahasa Malay
 ไทย
ไทย Español
 Deutsch
 Български
 Français
 Tiếng Việt
 中文
中文 বাংলা
বাংলা हिन्दी
 Čeština
 Українська
 Română

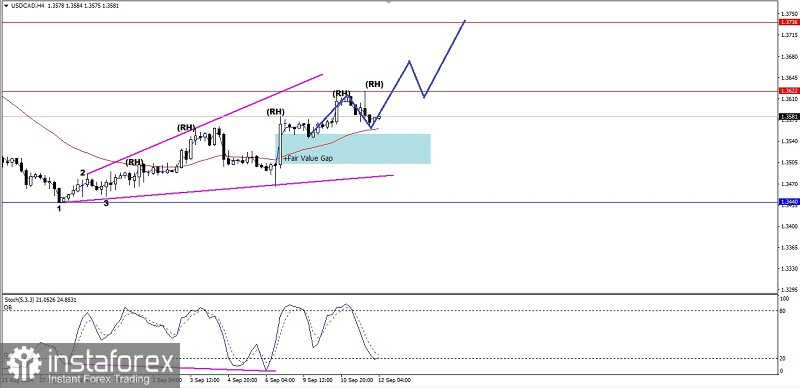
On the 4-hour chart of the USD/CAD commodity currency pair, there are several interesting things, first of all, there is a hidden deviation between the price movement of The Loonie which forms a Lower Low while on the contrary the Stochastic Oscillator indicator forms a Lower High, second, the appearance of a Bullish 123 pattern followed by a Bullish Ross Hook (RH) indicates that there is a strengthening on the 4-hour chart of USD/CAD where in the near future it has the potential to test the 1.3622 level as its main target and if the momentum and volatility support it, 1.3736 will be the next target to be targeted, but there is a third interesting thing where the appearance of an Ascending Broadening Wedge pattern also gives an indication that the current strengthening in USD/CAD is experiencing a weakening in its momentum so that in the near future there is also an indication of a correction of weakening again, but as long as the weakening does not penetrate below the 1.3466 level, The Loonie still has the potential to continue strengthening.
(Disclaimer)