 English
  Русский
 Bahasa Indonesia
 Bahasa Malay
 ไทย
ไทย Español
 Deutsch
 Български
 Français
 Tiếng Việt
 中文
中文 বাংলা
বাংলা हिन्दी
 Čeština
 Українська
 Română

5334.04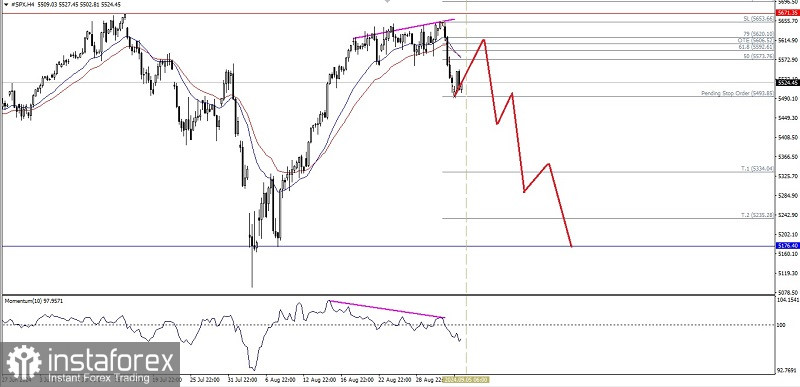
The S&P 500 index on its 4-hour chart is currently weakening, this is confirmed by its price movement which is moving below the EMA 21 & EMA 34 and the appearance of deviations between the #SPX price movement and the Momentum indicator so that in the near future it has the potential to bring the index down below the level of 5493.85 if this level is successfully broken below then #SPX has the potential to continue its weakening to the level of 5334.04 and if momentum and volatility support it then the level of 5176.40 will be the next target to be targeted but please note if there is a correction to strengthening that breaks above the level of 5697.13 then all the weakening scenarios that have been described previously will become invalid and canceled by themselves.
(Disclaimer)