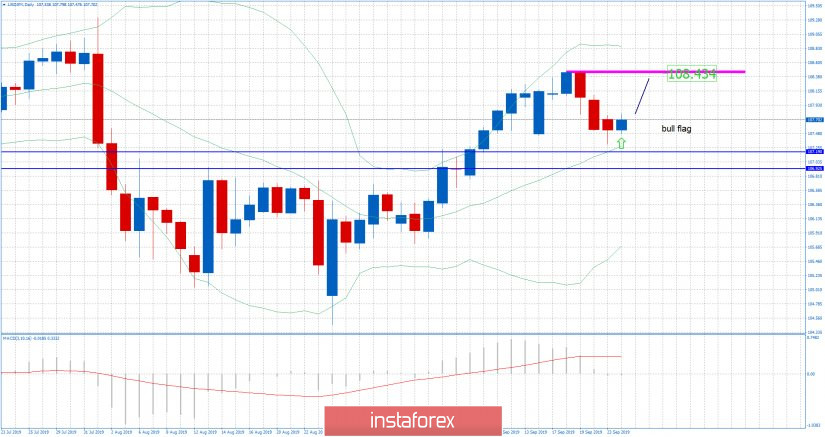
USD/JPY has been trading sideways in the past 24hours at the price of 107.70. I found very interesting to be on the long side due to re-test of the middle Bollinger band (20SMA) and there is potential more upside yet to come. I do expect potential test of 108.40.

Blue lines – Important support levels
Pink rectangle – Resistance and upward objective
Purple rising line – Expected path
MACD oscillator is decreasing on the downside momentum and there is expectation for more upside to come and potential new momentum up. USD/JPY is trying to created 3-bar balance, which may lead to potential next direction move. Support levels are found at 107.20 and 106.92 and resistance at 108.40. English
 Русский
 Bahasa Indonesia
 Bahasa Malay
 ไทย
ไทย Español
 Deutsch
 Български
 Français
 Tiếng Việt
 中文
中文 বাংলা
বাংলা हिन्दी
 Čeština
 Українська
 Română

