 English
  Русский
 Bahasa Indonesia
 Bahasa Malay
 ไทย
ไทย Español
 Deutsch
 Български
 Français
 Tiếng Việt
 中文
中文 বাংলা
বাংলা हिन्दी
 Čeština
 Українська
 Română

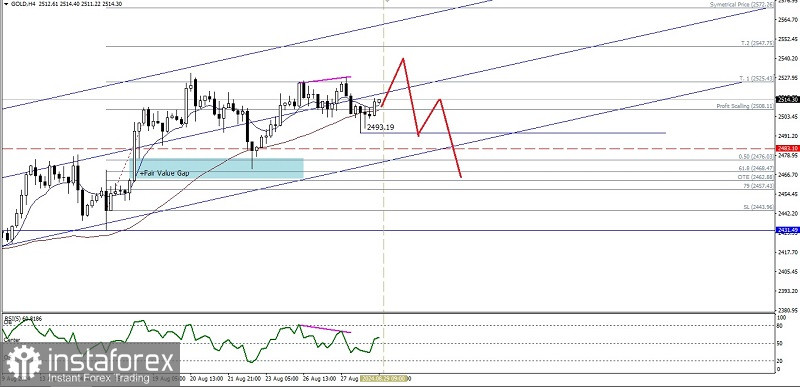
As we can see on the 4-hour chart of the Gold commodity asset, Buyers currently dominate, which is confirmed by the movement of Gold prices which move harmoniously within the Bullish Channel and are still above the MA 50, so that in the near future there is the potential to test the level of 2525.43, but with the appearance of deviations between the movement of Gold prices which form Higher Highs, on the other hand the RSI indicator (5) actually forms Higher Lows, so if this level fails to be broken upwards, it will cause Gold to potentially be corrected to weaken down to the level of 2493.13. If this level is successfully broken downwards, Gold will continue to weaken to the level of 2468.47.
(Disclaimer)