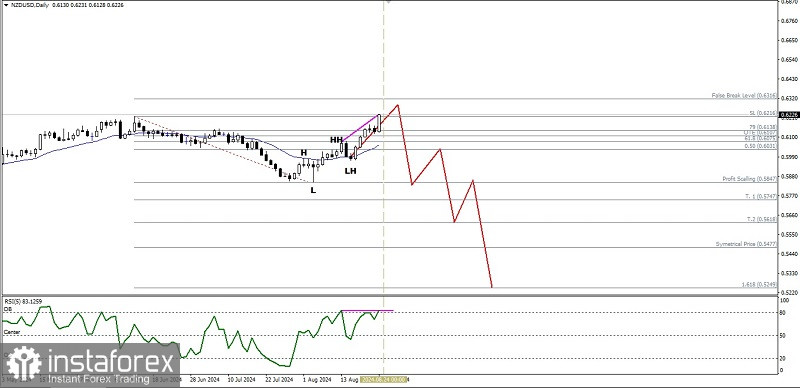
If we look at the daily chart of the NZD/USD commodity currency pair, it appears that the Kiwi is trying to test the 0.6316 level. If it turns out that this False Break level fails to be tested and penetrated upwards, then in the next few days the Kiwi has the potential to weaken and fall, where this has been confirmed by the emergence of deviations between its price movements which form Higher-High while the RSI indicator (5) actually forms a Double Top so the NZD/USD has the potential to weaken and fall, especially if it falls and closes below the 0.6031 level, which will bring the Kiwi to the 0.5847 level as its main target and if the momentum and volatility support it, then 0.5618 will be the next target to be aimed for in the next few days.
(Disclaimer)
 English
 Русский
 Bahasa Indonesia
 Bahasa Malay
 ไทย
ไทย Español
 Deutsch
 Български
 Français
 Tiếng Việt
 中文
中文 বাংলা
বাংলা हिन्दी
 Čeština
 Українська
 Română

