 English
  Русский
 Bahasa Indonesia
 Bahasa Malay
 ไทย
ไทย Español
 Deutsch
 Български
 Français
 Tiếng Việt
 中文
中文 বাংলা
বাংলা हिन्दी
 Čeština
 Українська
 Română

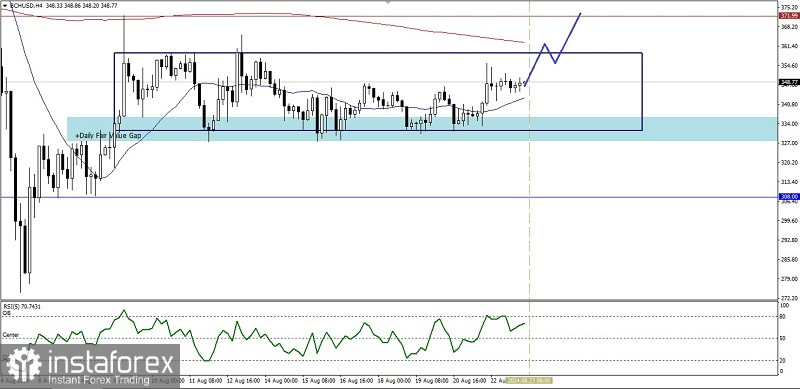
On the 4-hour chart, the BCH/USD cryptocurrency is seen moving in a ranging/sideways condition, which is clearly visible from its price movement between MA 20 and MA 200, but currently buyers have quietly started to enter, which is indicated by the RSI (5) indicator which is above level 50, so as long as there is no weakening that breaks below 308.00, BCH/USD has the potential to test and break through level 371.99 and if momentum and volatility support it, level 394.86 will be the next target to be targeted.
(Disclaimer)