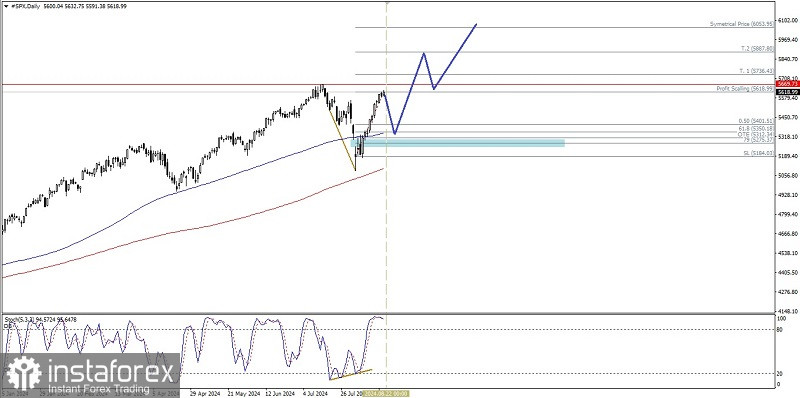
On the daily chart of the S&P 500 index, it appears that Buyers are dominating the index. This can be seen from the price movement above the MA 100 & MA 200 where the position of the MA 100 is also above the MA 200 and the appearance of deviations between the price movements of the index which form Lower - Low while the Stochastic Oscillator indicator actually forms Higher - Low so that based on these facts in the next few days, although there could be a weakening correction, as long as it does not breaks below the level of 5175.59 which is only momentary, then #SPX has the potential to strengthen again where the level of 5669.73 will try to be broken upwards and if successful, #SPX will continue its strengthening to the level of 5887.80 as its main target and 6053.95 as the next target if it turns out that momentum and volatility support it.
(Disclaimer)
 English
 Русский
 Bahasa Indonesia
 Bahasa Malay
 ไทย
ไทย Español
 Deutsch
 Български
 Français
 Tiếng Việt
 中文
中文 বাংলা
বাংলা हिन्दी
 Čeština
 Українська
 Română

