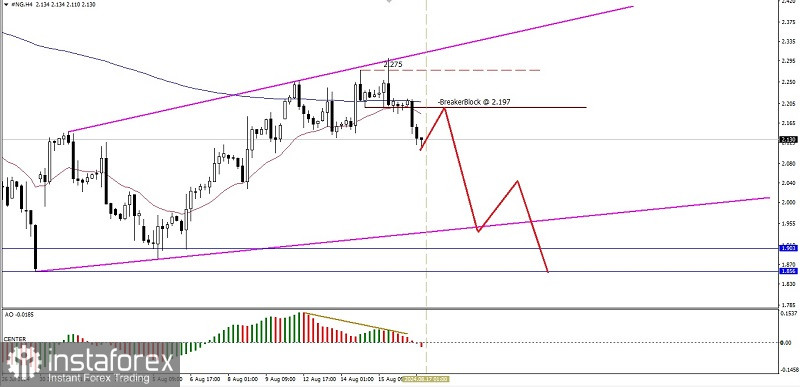
There are 3 interesting things from the 4-hour chart of the Natural Gas commodity asset, namely, first, the price movement of this commodity asset is moving below the EMA 20 & 50 which also happens to be EMA 20 below the EMA 200 which indicates that seller pressure is quite strong, second, the emergence of an Ascending Broadening Wedge pattern which shows that the strength of buyers is starting to decrease, and third, the emergence of a deviation between the price movement of #NG which forms a Higher High while the Awesome Oscillator indicator is on the contrary forming a Higher-Low so that based on these three facts, #NG in the near future has the potential to continue its weakening where the level of 2,028 will be tested to be redeemed below if successful then #CL will continue its weakening to the level of 1,903 if the momentum and volatility support it, but all these weakening scenarios will be invalid and canceled by themselves if suddenly there is a strengthening correction that breaks above the level of 2,214.
(Disclaimer)
 English
 Русский
 Bahasa Indonesia
 Bahasa Malay
 ไทย
ไทย Español
 Deutsch
 Български
 Français
 Tiếng Việt
 中文
中文 বাংলা
বাংলা हिन्दी
 Čeština
 Українська
 Română

