 English
  Русский
 Bahasa Indonesia
 Bahasa Malay
 ไทย
ไทย Español
 Deutsch
 Български
 Français
 Tiếng Việt
 中文
中文 বাংলা
বাংলা हिन्दी
 Čeština
 Українська
 Română

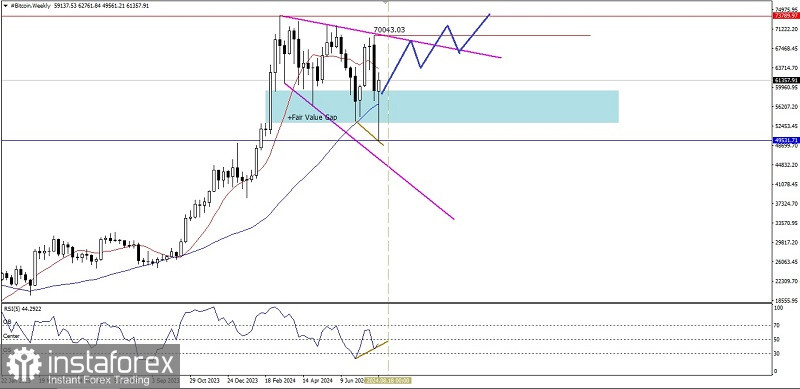
If we look at the weekly chart of the Bitcoin cryptocurrency, there are three interesting things, namely: First, MA 10 is above MA 39, which indicates that Bitcoin is still dominated by sellers, second, the detection of the Descending Broadening Wedge pattern, which indicates that the current weakening is a correction, and third, the appearance of a Divergence between Bitcoin price movements that form Lower-Low while the RSI indicator (5) actually forms Higher-High, so based on these three facts, as long as Bitcoin does not weaken and fall below the 49531.71 level, there is potential for Bitcoin to continue strengthening again to the 70043.03 level and if momentum and volatility support it, the 73789.97 level will be the next target to be aimed at.
(Disclaimer)