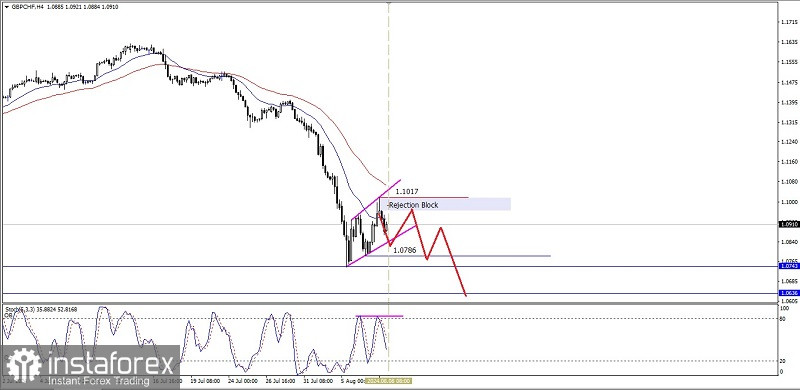
From what we can see on the 4-hour chart of the GBP/CHF cross currency pair, there are several interesting things. First, the EMA 20 intersects downwards from the EMA 50. Second, the Double Top pattern appears in the Stochastic Oscillator indicator. On the contrary, the GBP/CHF price movement forms a Higher - High and third, the strengthening correction that occurs actually forms an Ascending Broadening Wedge pattern where these three things indicate that in the near future GBP/CHF has the potential to weaken down to the 1.0786-1.0743 area level. If this area level is successfully broken downwards, then GBP/CHF will continue to weaken to the 1.0636 level. However, if on its way to these levels, there is suddenly a strengthening correction again, especially if it successfully breaks above the 1.1017 level, then all the weakening continuation scenarios that have been described previously will be invalid and canceled by themselves.
(Disclaimer)
 English
 Русский
 Bahasa Indonesia
 Bahasa Malay
 ไทย
ไทย Español
 Deutsch
 Български
 Français
 Tiếng Việt
 中文
中文 বাংলা
বাংলা हिन्दी
 Čeština
 Українська
 Română

