 English
  Русский
 Bahasa Indonesia
 Bahasa Malay
 ไทย
ไทย Español
 Deutsch
 Български
 Français
 Tiếng Việt
 中文
中文 বাংলা
বাংলা हिन्दी
 Čeština
 Українська
 Română

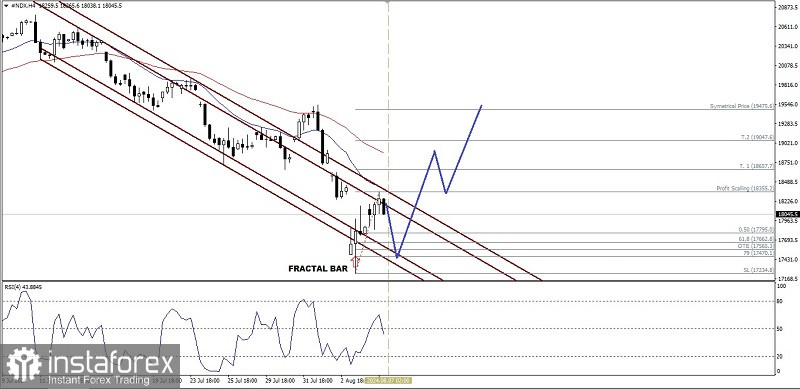
On the 4-hour chart, the Nasdaq 100 index is seen moving harmoniously in the Bearish channel and the EMA 20 position is below the EMA 50 and its price movement is below both EMAs, indicating that #NDX is being dominated by Sellers, but with the appearance of Fractal Candles, #NDX in the near future has the potential to be corrected to strengthen to the level of 18355.2 and if this level is successfully penetrated upwards, #NDX has the opportunity to continue its strengthening correction to the level of 18657.7 as its main target and 19475.6 as the next target if momentum and volatility support as long as there is no continuation from the previous bias, especially if it breaks below the level of 17234.8 because if this level is successfully broken downwards, all strengthening correction scenarios that have been described previously will become invalid and canceled by themselves.
(Disclaimer)