 English
  Русский
 Bahasa Indonesia
 Bahasa Malay
 ไทย
ไทย Español
 Deutsch
 Български
 Français
 Tiếng Việt
 中文
中文 বাংলা
বাংলা हिन्दी
 Čeština
 Українська
 Română

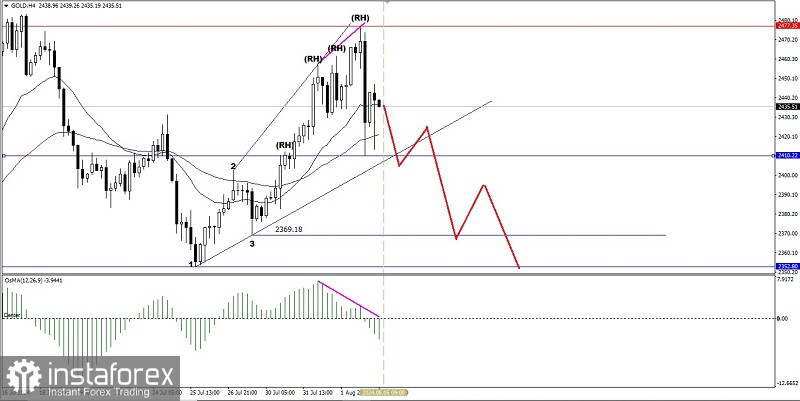
If we look at the 4-hour chart of the Gold commodity asset, there are several interesting things, namely the appearance of deviations between the movement of the Gold price and the MACD Histogram indicator and the Ascending Broadening Wedge pattern where all this information provides an indication that in the near future Gold has the potential to weaken down to the level of 2410.22 if this level is successfully broken below then Gold has the potential to continue its weakening to the level of 2369.18 or even if the momentum and volatility support then 2352.80 will be the next target but if on the way to weakening there is suddenly a significant strengthening correction especially if Gold manages to breaks above the level of 2477.35 then all the weakening scenarios that have been described previously will be canceled by themselves.
(Disclaimer)