 English
  Русский
 Bahasa Indonesia
 Bahasa Malay
 ไทย
ไทย Español
 Deutsch
 Български
 Français
 Tiếng Việt
 中文
中文 বাংলা
বাংলা हिन्दी
 Čeština
 Українська
 Română

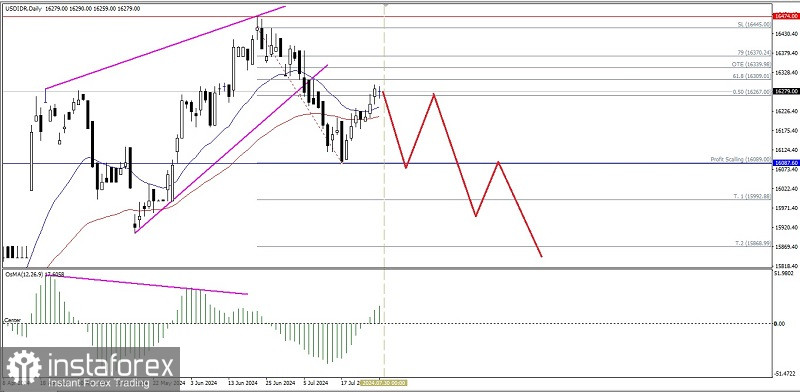
If we look at the daily chart of the exotic currency pair USD/IDR, there are several interesting things, first the appearance of the Rising Wedge pattern, second there is a deviation between the movement of the USD/IDR currency price and the MACD Histogram indicator so that based on these facts it is predicted that in the next few days USD/IDR has the opportunity to weaken against the Garuda currency (Rupiah) where as long as there is no further strengthening that penetrates above the level of 16474.00, then USD/IDR will continue to weaken to the level of 16087.60 and if this level is successfully penetrated below then the next level to be targeted is 15992.88 and if the momentum and volatility still support then 15868.99 will be the next target level to be achieved.
(Disclaimer)