 English
  Русский
 Bahasa Indonesia
 Bahasa Malay
 ไทย
ไทย Español
 Deutsch
 Български
 Français
 Tiếng Việt
 中文
中文 বাংলা
বাংলা हिन्दी
 Čeština
 Українська
 Română

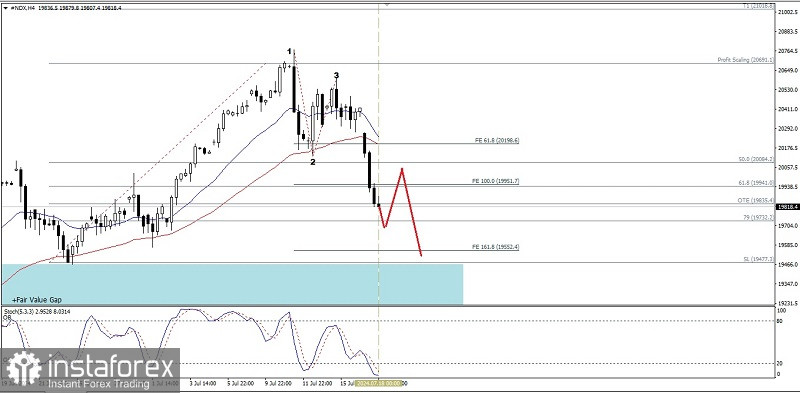
On the 4-hour chart of the Nasdaq 100 index appears to have a Bearish 123 pattern, followed by #NDX price movement conditions which are below EMA 20 & EMA 50, which confirms that currently Sellers are dominant on the 4-hour chart, so based on this fact, in the near future #NDX has the potential to continue its weakening to level 19732.2 and if the momentum and volatility support it, #NDX will continue its weakening again to level 19477.3, however, if on its way to the target levels suddenly there is a significant strengthening correction that breaks above the level 20158.1 then all weakening scenarios previously described will become invalid and automatically cancel itself.
(Disclaimer)