 English
  Русский
 Bahasa Indonesia
 Bahasa Malay
 ไทย
ไทย Español
 Deutsch
 Български
 Français
 Tiếng Việt
 中文
中文 বাংলা
বাংলা हिन्दी
 Čeština
 Українська
 Română

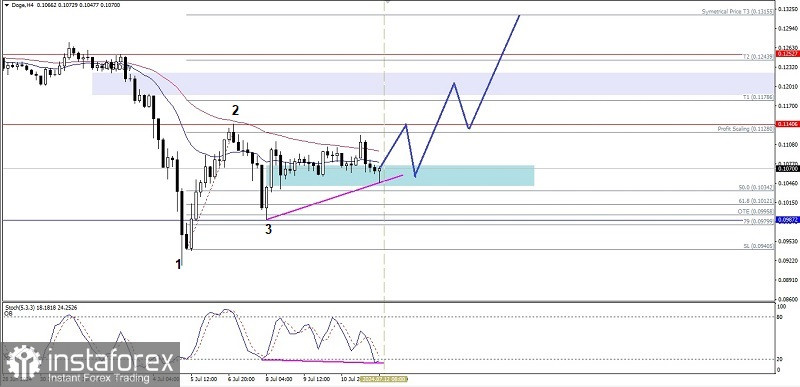
If we look at the 4-hour chart, we can see that the EMA 20 is moving inside the body of the Doge Crypto currency candle, which means that it is currently in a Sideways condition, but with the EMA 50 position being above this price movement, this indicates that there is still quite a lot of selling pressure, but with the appearance of a Bullish pattern 123 coupled with the appearance of hidden deviations where the Doge price movement made a Higher Low while the Stochastic Oscillator indicator actually formed a Lower Low, so based on these two facts, Doge in the near future has the potential to be corrected stronger and will try to broke above the 0.11406 level if on its way to breaking above this level it does not If it returns to its original bias and broken below the 0.10318 level, Doge has the potential to continue its strengthening up to the 0.11786 level as its main target and if momentum and volatility support it, Doge will go to 0.12439.
(Dsiclaimer)